23 Apr Matplotlib – Create multiple plots (side by side) in one figure
To create multiple plots side by side in Matplotlib, set 1 row and 2 columns for the subplot(). In Matplotlib, organize multiple plots within one figure by dividing the canvas into a grid using the plt.subplot(). Here is the syntax:
plt.subplot(nrows, ncols, index)
The following are the parameters of the subplot() function:
- nrows: number of rows in the grid.
- ncols: number of columns in the grid.
- index: position of the subplot (starts at 1).
Let us see an example:
# Create multiple plots (side by side) in one figure
import matplotlib.pyplot as plt
import numpy as np
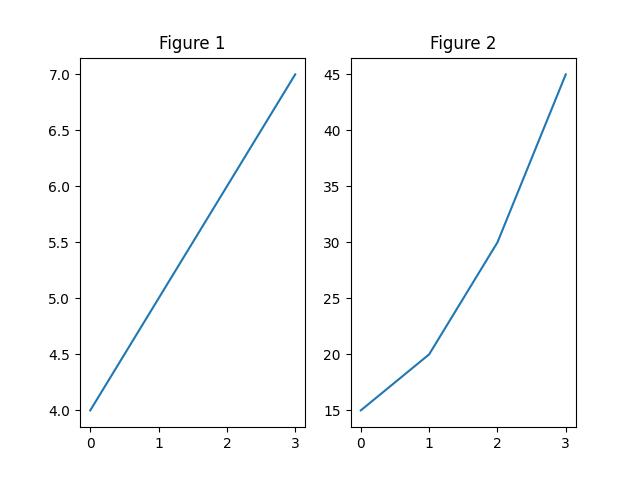
# Plot 1
xpts = np.array([0, 1, 2, 3])
ypts = np.array([4, 5, 6, 7])
# This means 1 row, 2 columns, 1st sublplot
plt.subplot(1, 2, 1)
plt.plot(xpts, ypts)
plt.title("Figure 1")
# Plot 2
xpts = np.array([0, 1, 2, 3])
ypts = np.array([15, 20, 30, 45])
# This means 1 row, 2 columns, 2nd sublplot
plt.subplot(1, 2, 2)
plt.plot(xpts, ypts)
plt.title("Figure 2")
# Displaying both the plots on a single figure
plt.show()
Output
If you liked the tutorial, spread the word and share the link and our website, Studyopedia, with others.
For Videos, Join Our YouTube Channel: Join Now
Read more:
- Machine Learning Tutorial
- Deep Learning Tutorial
- Statistics for ML
- Numpy Tutorial
- Pandas Tutorial
- Matplotlib Tutorial
- Google Colab Tutorial
- Anaconda Tutorial
- Python Libraries Tutorial
No Comments