15 Feb Change the font size of Matplotlib legend
To increase or decrease the font size of legends in a graph, use the fontsize parameter of the legend() method. The value of the fontsize can be:
- xx-small
- x-small
- small
- medium
- large
- x-large
- xx-large
Before moving further, we’ve prepared a video tutorial to change the font size of the Matplotlib Legend:
Example
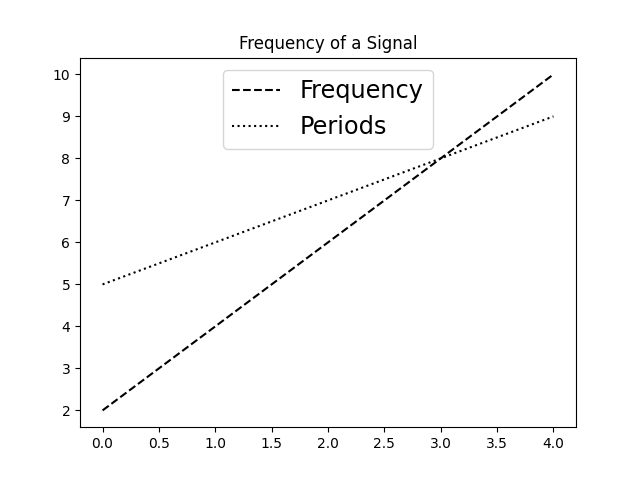
Let us see an example to set the font size of legends in Matplotlib. We will increase the size of the legend, wherein Frequency and Periods are set:
import numpy as np
import matplotlib.pyplot as plt

# Data
a = np.arange(5)
b = [2,4,6,8,10]
c = [5, 6, 7, 8, 9]

# Create plots
fig = plt.figure()
ax = plt.subplot()
ax.plot(a, b, 'k--', label='Frequency')
ax.plot(a, c, 'k:', label='Periods')

# Create a legend using the Matplotlib Axes.legend() method in Python.
# Set the position using the loc parameter of the legend() method
# Set the fontsize parameter of the legend() method to change the font size
legend = ax.legend(loc='upper center', fontsize='xx-large')

# Plot Title
plt.title("Frequency of a Signal")

# Display
plt.show()
Output
If you liked the tutorial, spread the word and share the link and our website Studyopedia with others.
For Videos, Join Our YouTube Channel: Join Now
Read More:
No Comments