15 Feb Matplotlib – Histogram
To plot a histogram, in Matplotlib, use the hist() method. Before moving further, we’ve prepared a video tutorial to plot a histogram in Matplotlib:
Example
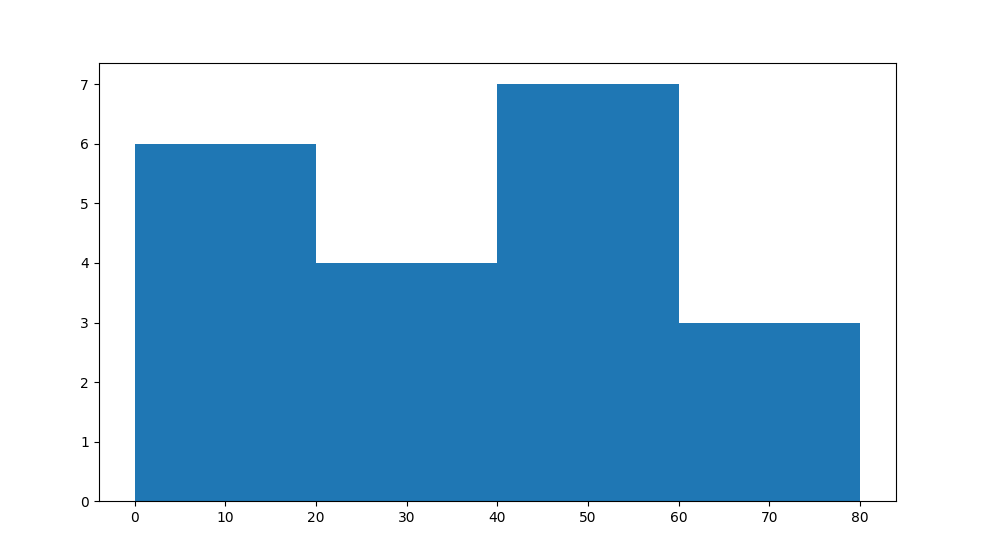
Let us see an example wherein we will plot a Histogram of scores by cricket players. In the example, we have set the following bins:
0-20
21-40
41-60
61-80
The bins shown above can be an integer or a sequence.
Let us see an example to display the players in the range.
import matplotlib.pyplot as plt
import numpy as np

# Data to plot
arr = np.array([10, 50, 34, 67, 21, 7, 59, 62, 45, 48, 10, 8, 41, 32, 66, 59, 18, 26, 51, 9])

# Plot a Histogram using pyplot.hist() method
# The bins parameter sets the bin i.e. an integer or sequence
plt.hist(arr, bins = [0, 20, 40, 60, 80])


# Display the figure
plt.show()
Output
If you liked the tutorial, spread the word and share the link and our website, Studyopedia, with others.
For Videos, Join Our YouTube Channel: Join Now
Read More:
No Comments