31 Jan Matplotlib – Add Labels to a Plot
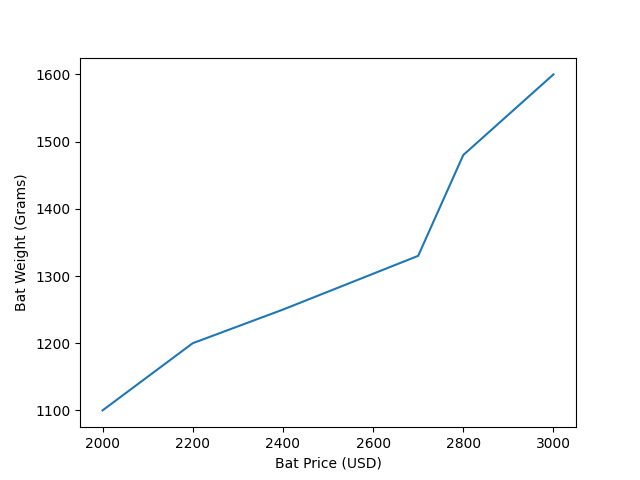
We can add labels to a plot easily in Matplotlib using two methods i.e. xlabel() for x-coordinates and ylabel() for y-coordinates. Let us see an example;
|
1 2 3 4 5 6 7 8 9 10 11 12 13 14 15 16 17 18 19 20 21 22 23 24 |
import pandas as pd import matplotlib.pyplot as plt # DataFrame with 3 columns dataFrame = pd.DataFrame( { "Cricket_Bat": ['SG', 'BDM', 'SS', 'GM', 'Kookaburra', 'Spartan'], "MRP": [2000, 2200, 2400, 2700, 2800, 3000], "Weight_Grams": [1100, 1200, 1250, 1330, 1480, 1600] } ) # Plot a line graph using the pyplot.plot() method # The x and y coordinates are the columns of the DataFrame plt.plot(dataFrame["MRP"], dataFrame["Weight_Grams"]) # The labels for x-coordinate and y-coordinate plt.xlabel("Bat Price (USD)") plt.ylabel("Bat Weight (Grams)") # Display the figure plt.show() |
Output

If you liked the tutorial, spread the word and share the link and our website Studyopedia with others.
For Videos, Join Our YouTube Channel: Join Now


No Comments