23 Apr Matplotlib – Change the line color
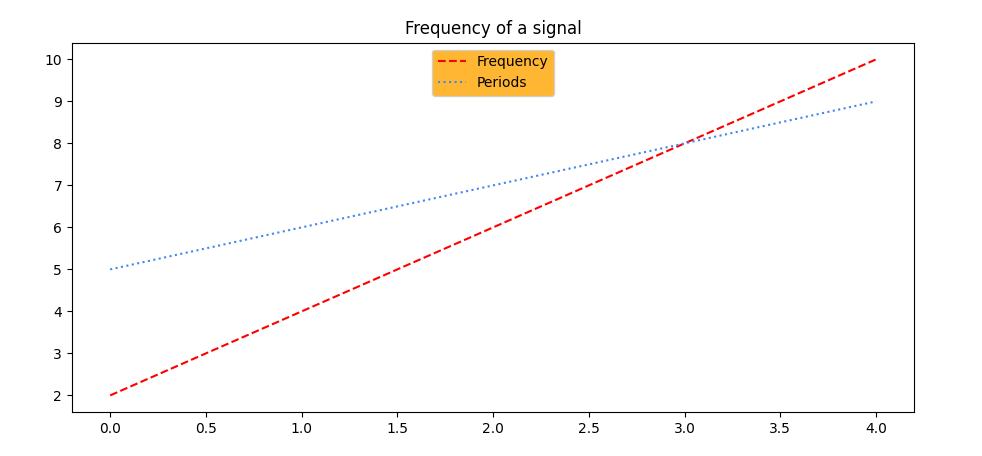
To change the line color of a line graph in Matplotlib, use the color parameter of the plot() function. Let us see an example:
# Change the line color

import matplotlib.pyplot as plt
import numpy as np

# Data
a = np.arange(5) # [0 1 2 3 4]
b = [2, 4, 6, 8, 10]
c = [5, 6, 7, 8, 9]

# Create a plot
ax = plt.subplot()

ax.plot(a, b, 'k--', label='Frequency', color='red')
ax.plot(a, c, 'k:', label='Periods',color='#4285F4')

# legend
legend = ax.legend(loc='upper center')
legend.get_frame().set_facecolor('orange')

plt.title("Frequency of a signal")

plt.show()
Output
If you liked the tutorial, spread the word and share the link and our website, Studyopedia, with others.
For Videos, Join Our YouTube Channel: Join Now
Read more:
- Machine Learning Tutorial
- Deep Learning Tutorial
- Statistics for ML
- Numpy Tutorial
- Pandas Tutorial
- Matplotlib Tutorial
- Google Colab Tutorial
- Anaconda Tutorial
- Python Libraries Tutorial
No Comments