23 Apr Create Markers in Matplotlib
In Matplotlib, markers are used to highlight individual data points on plots, making them easier to read and visually distinct. You can customize marker style, size, edge color, and face color using simple arguments in plt.plot() or plt.scatter().
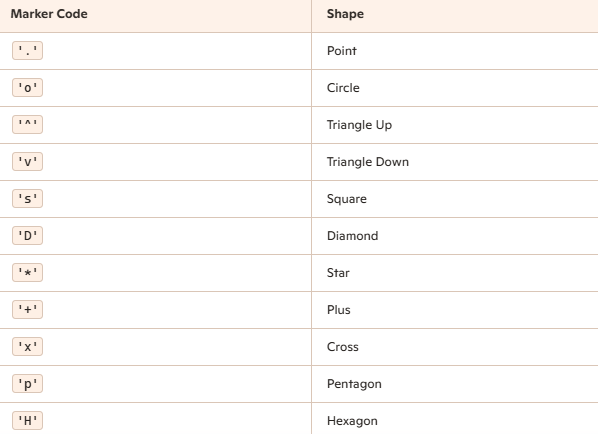
To create a marker, use the marker parameter of the plt.plot(). Set the marker styles for the marker parameter, like:
marker='*'
marker='o'
Common Marker Styles
Example
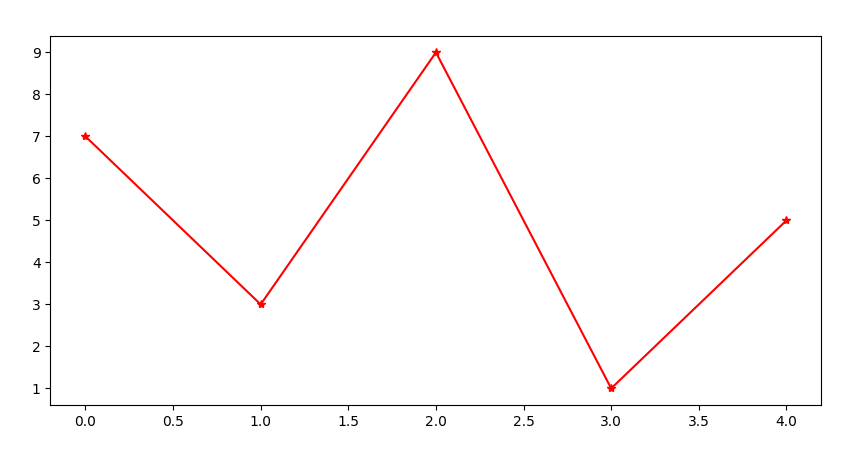
Let us see an example to create markers in Matplotlib:
# Create Markers in Matplotlib with linestyle

import matplotlib.pyplot as plt
import numpy as np

ypts = np.array([7, 3, 9, 1, 5])

# plt.plot(ypts, marker='o', linestyle=':', color='red')
plt.plot(ypts, marker='*', linestyle='-', color='red')
plt.show()
Output
If you liked the tutorial, spread the word and share the link and our website, Studyopedia, with others.
For Videos, Join Our YouTube Channel: Join Now
Read more:
- Machine Learning Tutorial
- Deep Learning Tutorial
- Statistics for ML
- Numpy Tutorial
- Pandas Tutorial
- Matplotlib Tutorial
- Google Colab Tutorial
- Anaconda Tutorial
- Python Libraries Tutorial
No Comments