23 Apr Matplotlib – Add Grid Lines on x or y axis
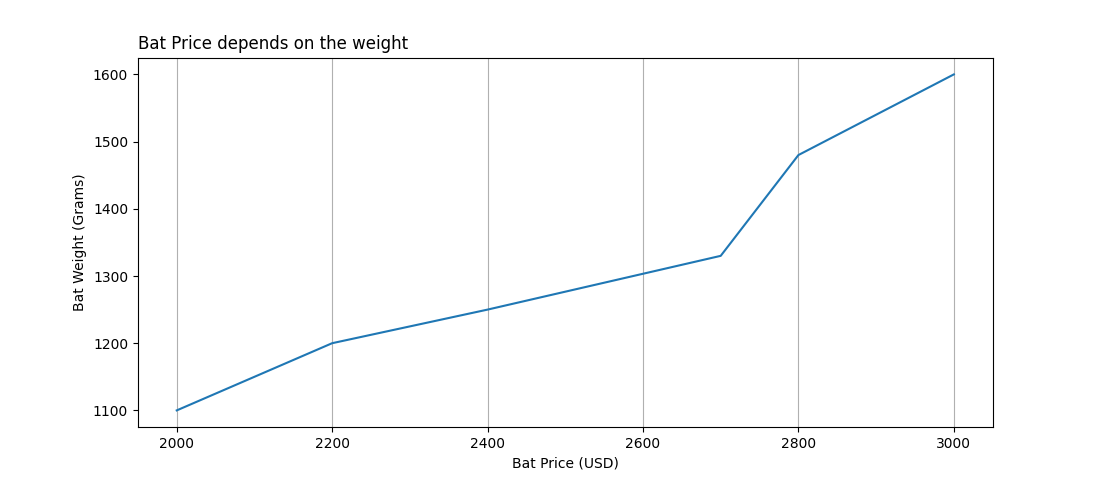
In Matplotlib, add grid lines on the x or y axis using the axis parameter of the plt.grid() function. Let us see an example:
# Add Grid Lines on x or y axis

import pandas as pd
import matplotlib.pyplot as plt

df = pd.DataFrame(
    {
        "Cricket_Bat":['SG', 'BDM', 'SS', 'GM', 'Kookaburra', 'Spartan'],
        "MRP": [2000, 2200, 2400, 2700, 2800, 3000],
        "Weight_Grams": [1100, 1200, 1250, 1330, 1480, 1600]
    }
)

plt.plot(df['MRP'], df['Weight_Grams'])

plt.xlabel('Bat Price (USD)')
plt.ylabel('Bat Weight (Grams)')

plt.title('Bat Price depends on the weight', loc='left')

plt.grid(axis = 'x')
plt.show()
Output
If you liked the tutorial, spread the word and share the link and our website, Studyopedia, with others.
For Videos, Join Our YouTube Channel: Join Now
Read more:
- Machine Learning Tutorial
- Deep Learning Tutorial
- Statistics for ML
- Numpy Tutorial
- Pandas Tutorial
- Matplotlib Tutorial
- Google Colab Tutorial
- Anaconda Tutorial
- Python Libraries Tutorial
No Comments