23 Apr Set the Marker edge color in Matplotlib
In Matplotlib, you can set the marker edge color using the markeredgecolor parameter (or its shorthand mec) in plotting functions like plot(), scatter(), etc. This lets you control the outline color of markers independently from their fill color.
Let us see an example:
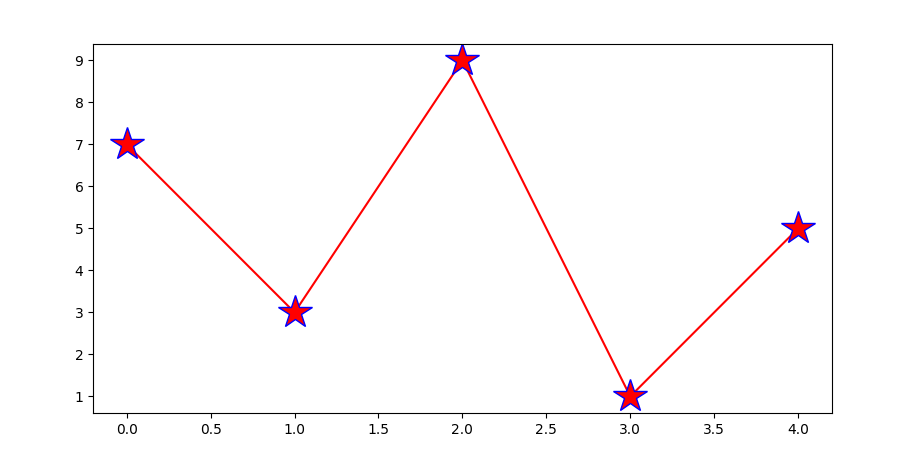
# Set the Marker edge color in Matplotlib

import matplotlib.pyplot as plt
import numpy as np

ypts = np.array([7, 3, 9, 1, 5])

plt.plot(ypts, marker='*', ms = 25, mec = 'b', linestyle='-', color='red')
plt.show()
Output
If you liked the tutorial, spread the word and share the link and our website, Studyopedia, with others.
For Videos, Join Our YouTube Channel: Join Now
Read more:
- Machine Learning Tutorial
- Deep Learning Tutorial
- Statistics for ML
- Numpy Tutorial
- Pandas Tutorial
- Matplotlib Tutorial
- Google Colab Tutorial
- Anaconda Tutorial
- Python Libraries Tutorial
No Comments