23 Apr Marker size in Matplotlib
In Matplotlib, marker size is controlled with markersize (shorthand ms) in plot() and the s parameter in scatter(). The key difference is that markersize sets the diameter in points, while s sets the marker area in points.
In this lesson, we will set the marker size in Matplotlib using the ms parameter of the Matplotlib plot() function.
Let us see an example:
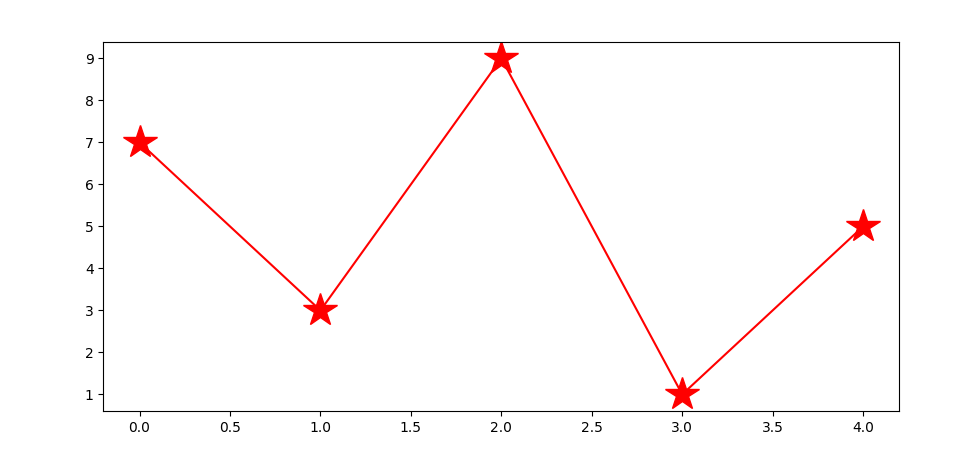
# Set the Marker size in Matplotlib

import matplotlib.pyplot as plt
import numpy as np

ypts = np.array([7, 3, 9, 1, 5])

plt.plot(ypts, marker='*', ms = 25, linestyle='-', color='red')
plt.show()
Output
If you liked the tutorial, spread the word and share the link and our website, Studyopedia, with others.
For Videos, Join Our YouTube Channel: Join Now
Read more:
- Machine Learning Tutorial
- Deep Learning Tutorial
- Statistics for ML
- Numpy Tutorial
- Pandas Tutorial
- Matplotlib Tutorial
- Google Colab Tutorial
- Anaconda Tutorial
- Python Libraries Tutorial
No Comments