31 Jan Matplotlib – Plotting
In this lesson, we will plot a line in Matplotlib. Before moving further, we’ve prepared a video tutorial to learn how to plot a line in Matplotlib:
For the x and y input, let us consider a DataFrame. The following is the library to be imported for Pandas:
import pandas as pd
The following is the library to be imported for Matplotlib with the PyPlot sub-module:
import matplotlib.pyplot as plt
First, create a DataFrame. The Pandas DataFrame is a Two-dimensional, tabular data, table with rows and columns. The DataFrame() method is used for this purpose:
# DataFrame with 3 columns
dataFrame = pd.DataFrame(
{
"Cricket_Bat": ['SG', 'BDM', 'SS', 'GM', 'Kookaburra', 'Spartan'],
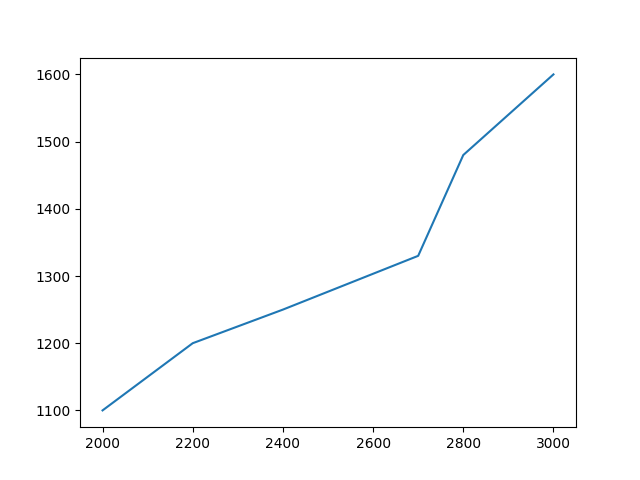
"MRP": [2000, 2200, 2400, 2700, 2800, 3000],
"Weight_Grams": [1100, 1200, 1250, 1330, 1480, 1600]
}
)
The columns of the DataFrame will be used for both the x and y coordinates of the plot():
plt.plot(dataFrame["MRP"], dataFrame["Weight_Grams"])
Let us now see the complete example to plot in Matplotlib:
import pandas as pd
import matplotlib.pyplot as plt

# DataFrame with 3 columns
dataFrame = pd.DataFrame(
  {
     "Cricket_Bat": ['SG', 'BDM', 'SS', 'GM', 'Kookaburra', 'Spartan'],
     "MRP": [2000, 2200, 2400, 2700, 2800, 3000],
     "Weight_Grams": [1100, 1200, 1250, 1330, 1480, 1600]
  }
)

# Plot a line graph using the pyplot.plot() method
# The x and y coordinates are the colimns of the DataFrame
plt.plot(dataFrame["MRP"], dataFrame["Weight_Grams"])

# Display the figure
plt.show()
Output
If you liked the tutorial, spread the word and share the link and our website Studyopedia with others.
For Videos, Join Our YouTube Channel: Join Now
Read More:
No Comments