31 Jan Matplotlib – Plot Titles and Position them
To set the titles in a graph, use the title() method in Matplotlib. Before moving further, we’ve prepared a video tutorial to learn to plot titles and position them in Matplotlib:
Position the title using the loc parameter of the title(). For the left title, use the left parameter value:
|
1 2 3 |
plt.title('Left Title', loc='left') |
For the right title, use the right parameter value:
|
1 2 3 |
plt.title('Right Title', loc='right') |
The center title is the default:
|
1 2 3 |
plt.title('Center Title') |
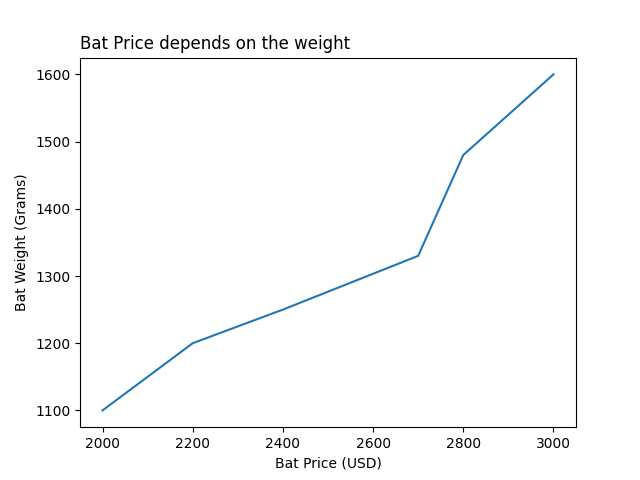
Let us see an example to set a title and its position as well in Matplotlib:
|
1 2 3 4 5 6 7 8 9 10 11 12 13 14 15 16 17 18 19 20 21 22 23 24 25 26 27 |
import pandas as pd import matplotlib.pyplot as plt # DataFrame with 3 columns dataFrame = pd.DataFrame( { "Cricket_Bat": ['SG', 'BDM', 'SS', 'GM', 'Kookaburra', 'Spartan'], "MRP": [2000, 2200, 2400, 2700, 2800, 3000], "Weight_Grams": [1100, 1200, 1250, 1330, 1480, 1600] } ) # Plot a line graph using the pyplot.plot() method # The x and y coordinates are the columns of the DataFrame plt.plot(dataFrame["MRP"], dataFrame["Weight_Grams"]) # The labels for x-coordinate and y-coordinate plt.xlabel("Bat Price (USD)") plt.ylabel("Bat Weight (Grams)") # Set the title on the left plt.title('Bat Price depends on the weight', loc='left') # Display the figure plt.show() |
Output

If you liked the tutorial, spread the word and share the link and our website Studyopedia with others.
For Videos, Join Our YouTube Channel: Join Now
Read More:


No Comments