05 Dec Tableau – Top Filters
Top filters in Tableau allow you to filter data to show only the top N values based on a specific measure or dimension. This feature is useful when you want to focus on the most important or relevant data.
Before moving further, we’ve prepared a video tutorial on what are Top Filters in Tableau:
Top Filters in Tableau
The Top Filter is used to get, let us say the sub-category of products with top 5 or 10 sales. Let us create a new sheet and name it Top Filter in the same Amit_Tableau_Filters.twb Tableau Workbook.
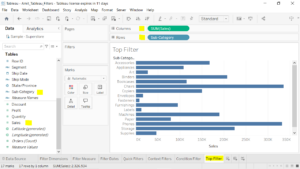
First, drag the Measure Sales to the Columns shelf, and Dimension Sub-Category to the Rows shelf. After dragging, the horizontal bar chart will be visible as shown below:

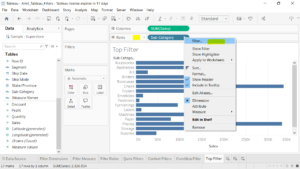
Right-click the Sub-Category and click Filter:

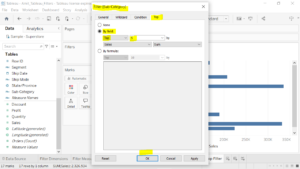
Go to the Top tab on the Filter [Sub-Category] window.
Click the drop-down, and select the option By field. Keep it to the Top and the value to 5 and rest as it is. i.e., keep the rest, Sales, and Sum dropdown as it is, and click OK. This will give us the sub-category of products with top 5 sales.

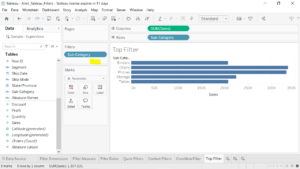
Now, after clicking OK above, the bar chart displays a sub-category of products with top 5 sales:

If you liked the tutorial, spread the word and share the link and our website Studyopedia with others.
For Videos, Join Our YouTube Channel: Join Now
Read More:


No Comments