05 Dec Tableau – Filters and its types
In Tableau, a filter is a way to narrow down the data that is displayed in a visualization. Filters allow you to select specific data points, dimensions, or measures to include or exclude from the view.
Think of filters like a sieve that helps you refine your data to show only the most relevant information. By applying filters, you can:
- Reduce data complexity
- Focus on specific trends or patterns
- Highlight important insights
- Create interactive dashboards that allow users to explore different scenarios
Before moving further, we’ve prepared a video tutorial on what is a filter with its types in Tableau:
Types of Filters in Tableau
In Tableau, you can create filters based on various data elements, such as:
- Dimensions: Filter by categorical values, like regions, products, or dates.
- Measures: Filter by numerical values, like sales, profits, or quantities.
- Dates: Filter by specific date ranges or periods.
We will create a new Tableau Workbook. Open Tableau and follow the Connect Data Sources in Tableau lesson steps to import the Sample-Superstore.xls as a Data Source.
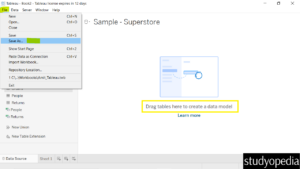
After importing, go to File, and click Save As to save the new workbook as Amit_Tableau_Filters.twb. Drag the Orders tables on the canvas:

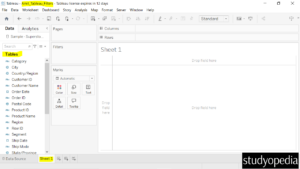
Also, click Sheet 1 below to show a new sheet. The file name on the top is also visible as Amit_Tableau_Filters. On the left, the columns of the Orders table are also visible:

Now, let us create filters, and consider the three types:
We have also discussed the other ways in which Filters can be set in Tableau:
Let us begin with Filter Dimensions.
If you liked the tutorial, spread the word and share the link and our website Studyopedia with others.
For Videos, Join Our YouTube Channel: Join Now
Read More:


No Comments