05 Dec Tableau – Filter Measures
Filter Measures means to filter by numerical values, like sales, profits, or quantities. These filters are applied only to the measure fields.
Before moving further, we’ve prepared a video tutorial on what are Filter Measures in Tableau:
Filter Measures in Tableau
Let us create a new sheet and give it a name, Filter Measure in the same Amit_Tableau_Filters.twb Tableau Workbook.
Drag the Sub-Category to the Rows shelf, and the Profit to the Columns shelf:
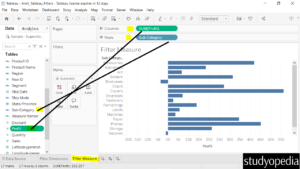
The above is the Sum of Profit in the column. To change it to Average, click on it. Go to Measure(Sum), and click Average to get the average Profit:
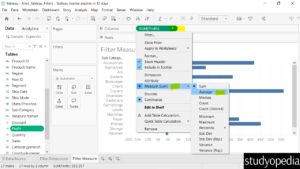
Now, AVG(Profit) is visible in place of SUM(Profit) below.
Keep the mouse cursor to get the exact average profit of any of the sub-categories as shown below:
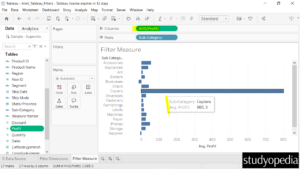
Drag the Measure Profit from the left to the Filter.
After that, a Filter Field dialog box will open. Select Average and click Next:
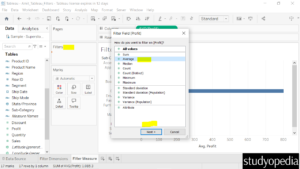
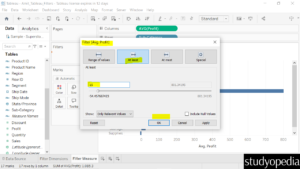
Choose At least and give a value to filter the rows. We have given 15 and clicked OK:
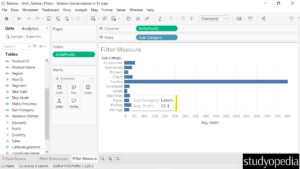
Now, only the sub-categories with average profit above 15 are visible. Verify the exact value by keeping the mouse cursor:
If you liked the tutorial, spread the word and share the link and our website Studyopedia with others.
For Videos, Join Our YouTube Channel: Join Now
Read More:


No Comments