05 Dec Create an Area Chart in Tableau
An Area Chart is a type of data visualization that displays the trend of a quantitative value over time or across categories. It is used to:
- Show cumulative totals over time
- Compare the contribution of different categories to a whole
- Highlight trends and patterns in the data
An Area Chart typically consists of:
- A horizontal axis representing time or categories
- A vertical axis representing the quantitative value
- Colored areas under the lines represent the cumulative values
Before moving further, we’ve prepared a video tutorial on how to create an Area Chart in Tableau:
Suppose we want to visualize the monthly sales of a company over a year:
- Month (horizontal axis)
- Sales (vertical axis)
- Sales data for each month
The area chart would display:
- A line representing the sales trend over the year
- Colored areas under the line represent the cumulative sales for each month
- The height of the colored areas represents the sales value for each month
This visualization helps to:
- See the overall sales trend over the year
- Identify the months with the highest and lowest sales
- Understand the cumulative sales over time
How to create an Area Chart in Tableau
Let us see an example to create an Area Chart in Tableau. Create an Area Chart to find the profit for each Sub-Category of the product.
We have created a new sheet named Area Chart in the same Tableau project Amit_Tableau.twb. As shown in the Get Data – Connect Data Source lesson, we have already loaded the sample data.
Drag the fields to the respective pane:
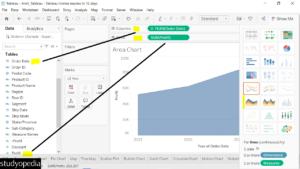
- Order Date Dimension: Drag to the Column shelf.
- Profit Measure: Drag to the Rows shelf
The following is visible. Select the chart type Area Chart from the right:
Now, drag the Sub Category to Color in the Marks pane to apply the color and differentiate:
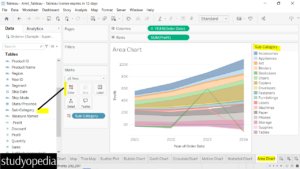
Above, on the right the legend for the Sub-Category is visible.
If you liked the tutorial, spread the word and share the link and our website Studyopedia with others.
For Videos, Join Our YouTube Channel: Join Now
Read More:
No Comments