04 Dec Create a Gantt Chart in Tableau
A Gantt chart is a type of bar chart that illustrates a project schedule, showing the tasks, dependencies, and timelines for completing a project. It is a useful tool for project management, helping to:
- Visualize the project timeline
- Track progress and deadlines
- Identify dependencies and critical path tasks
- Allocate resources and plan workloads
Before moving further, we’ve prepared a video tutorial on how to create a Gantt Chart in Tableau:
Suppose we want to plan a marketing campaign for a new product launch. The campaign consists of the following tasks:
- Week 1-2: Social media setup and content creation
- Week 3-4: Influencer outreach and partnership development
- Week 5-6: Email marketing campaign design and deployment
- Week 7-8: Paid advertising (Google Ads, Facebook Ads)
- Week 9: Launch event planning and execution
- Week 10: Post-launch review and analysis
The Gantt chart would display these tasks as horizontal bars, showing the start and end dates, and dependencies between tasks. This visualization helps the marketing team:
- Plan and schedule tasks
- Identify dependencies and potential roadblocks
- Track progress and stay on schedule
- Allocate resources and assign tasks to team members
How to create a Gantt Chart in Tableau
Let us see an example to create a Gantt Chart in Tableau. We have created a new sheet with the name Gantt Chart in the same Tableau project Amit_Tableau.twb. We have already loaded the sample data as shown in the Get Data – Connect Data Source lesson.
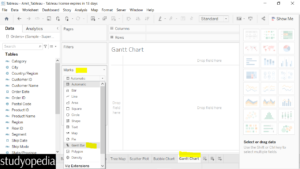
Go to the Marks card and from the dropdown, click Gantt Bar:
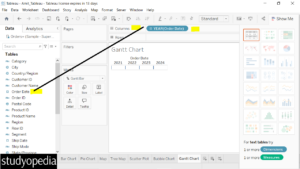
Now, drag the Order Date from the Dimensions to the Columns Shelf:
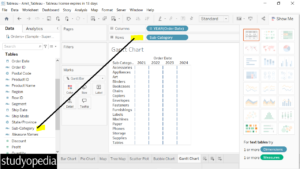
Drag Sub-Category to the Rows shelf:
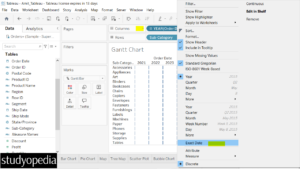
Right-click on the Order Date under the Columns Shelf and select Exact Date. The order date will convert into exact dates:
Again right-click on the Order Date and click Filter:
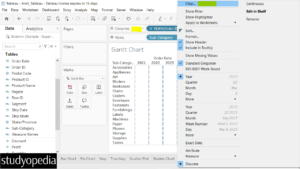
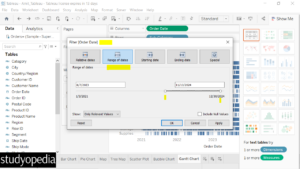
Select a range of dates, and click Apply, and then OK:
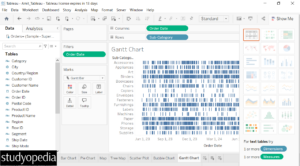
Now, the following is visible:
Now, drag the Dimension Ship Mode to the Color in the Marks card.
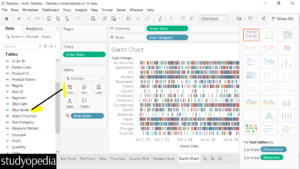
Drag the Measure Quantity to the Size in the Marks card:
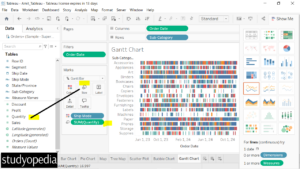
Above, the Gantt chart is visible.
Keep the mouse cursor and the details are visible:
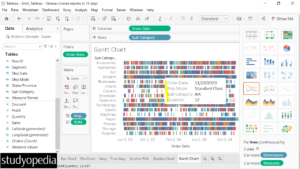
If you liked the tutorial, spread the word and share the link and our website Studyopedia with others.
For Videos, Join Our YouTube Channel: Join Now
Read More:


No Comments