03 Dec Connect Data Sources in Tableau
With Tableau, you can easily connect with over 100 data sources. Also, Tableau provides a sample Excel file, which is placed in the Tableau Repository folder. Let us see how to connect and import a data source in Tableau.
Before moving further, we’ve prepared a video tutorial on how to connect sources like Excel in Tableau:
Let us now see the steps to import the data from an Excel file and load it:
Steps to import data from Excel in Tableau
Begin with installing Tableau on your system. After installing, open Tableau.
On opening Tableau for the first time, on the left you can see the option to connect to a file or a server:
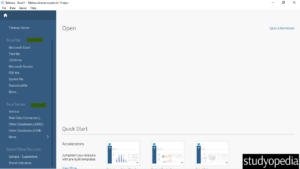
We will connect with the Microsoft Excel file, but from where we will get the sample data? Do not worry about that, Tableau provided you with sample data. Check the bottom-left and the Saved Data Source section is visible:
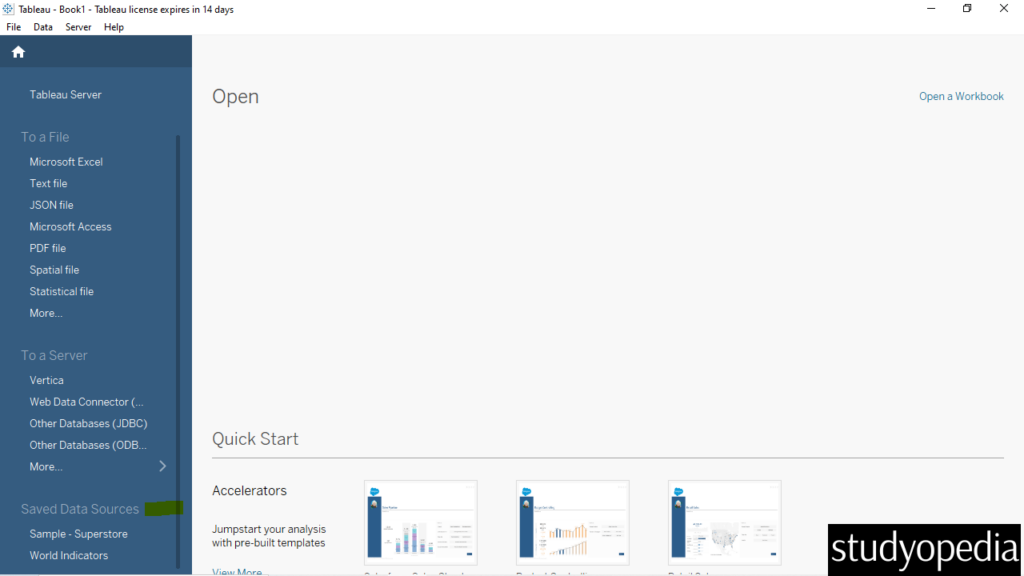
Above, the Sample – Superstore and World Indicators file is visible. Since this is provided by Tableau itself, the path of these files is the following:
|
1 2 3 |
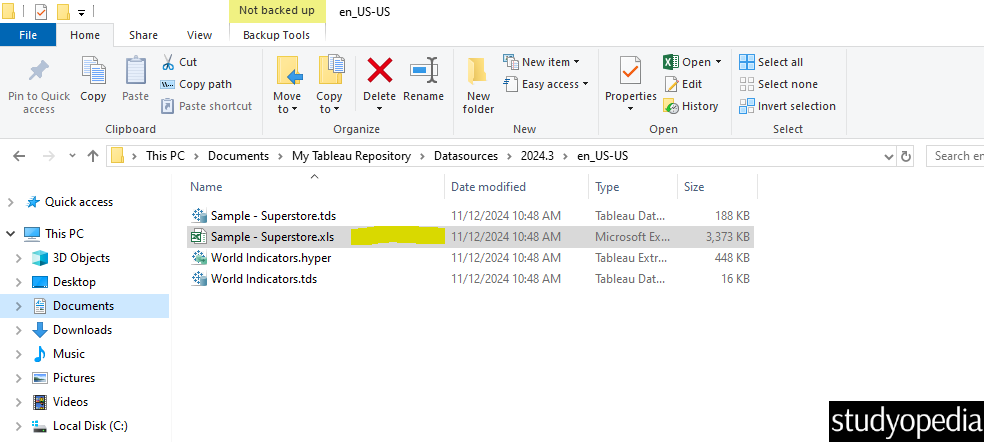
C:\Users\DELL\Documents\My Tableau Repository\Datasources\2024.3\en_US-US |
Here is the screenshot of the path displaying our sample data Sample – Superstor.xls:
From the Tableau, reach the Go to File section of the left and click Microsoft Excel:
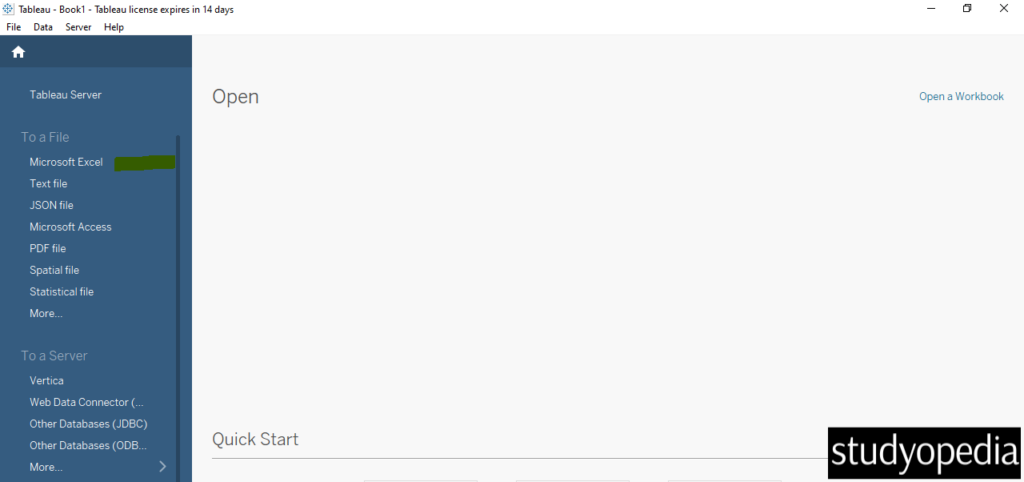
After clicking Microsoft Excel, reach the same Tableau Repository path, and select the same file Sample – Superstor.xls, and click Open:
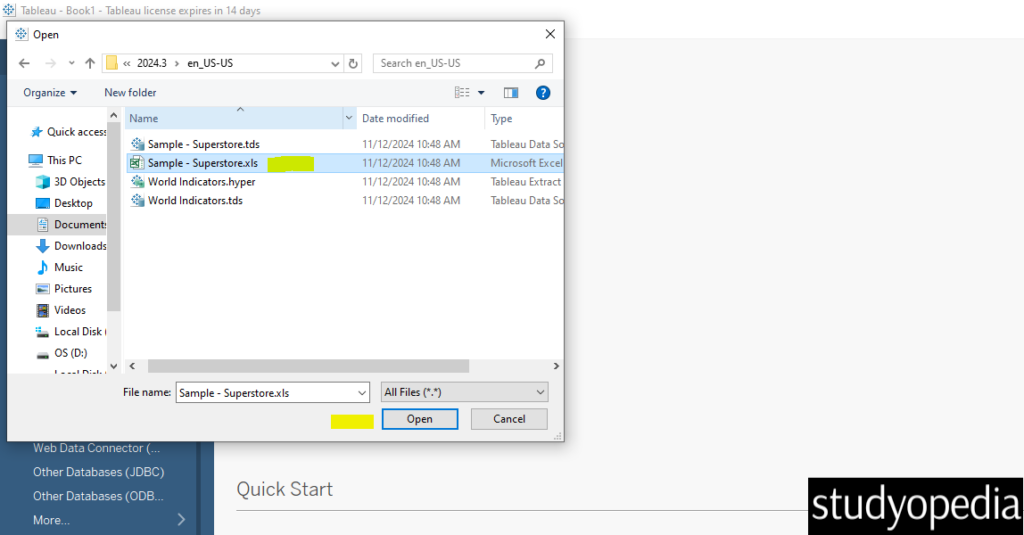
We loaded our Excel file successfully. On the left, the three workbooks Orders, People, and Returns of the excel file Sample – Superstore is visible:
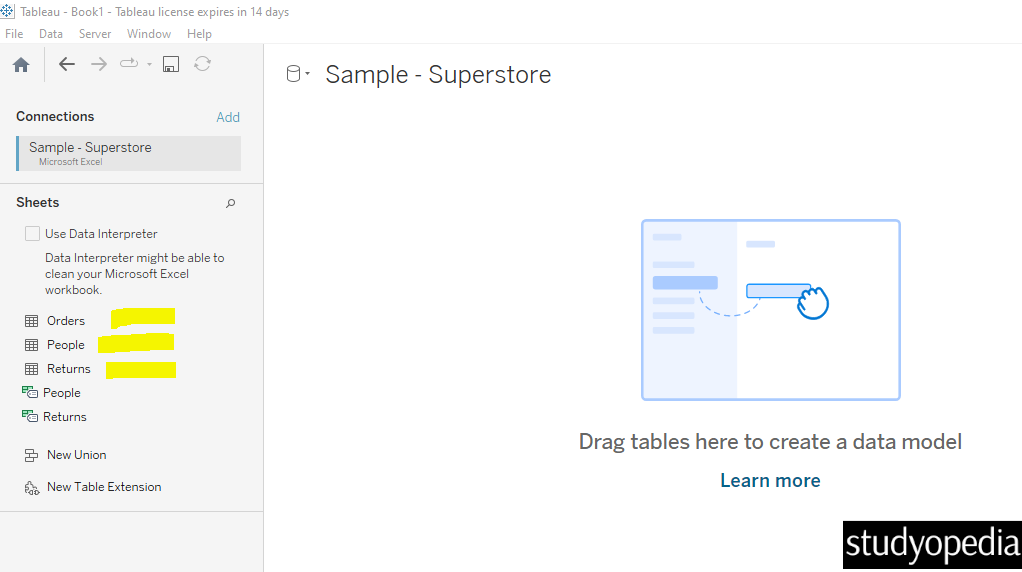
Now, let us drag the Orders workbook from the left to the center i.e. where Drag Tables here to create a data model section is visible. This section is called canvas.
After dragging the workbook Orders, the table with the records will be visible as shown below:
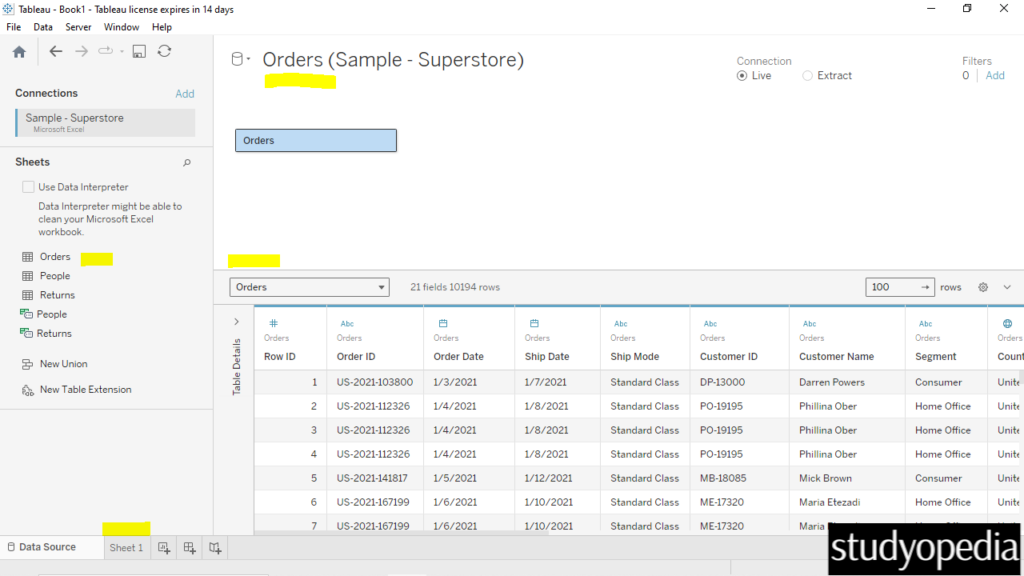
The records with the fields are visible above. Right now, you are on the left of Sheet 1 i.e. Data Source on the bottom left.
I will now zoom the table using CTRL+Click to let it be more visible. Now, I have also pointed to the datatypes visible above each column. The data type of the records itself displays what kind of records a column is having, such as text, number, date, etc:
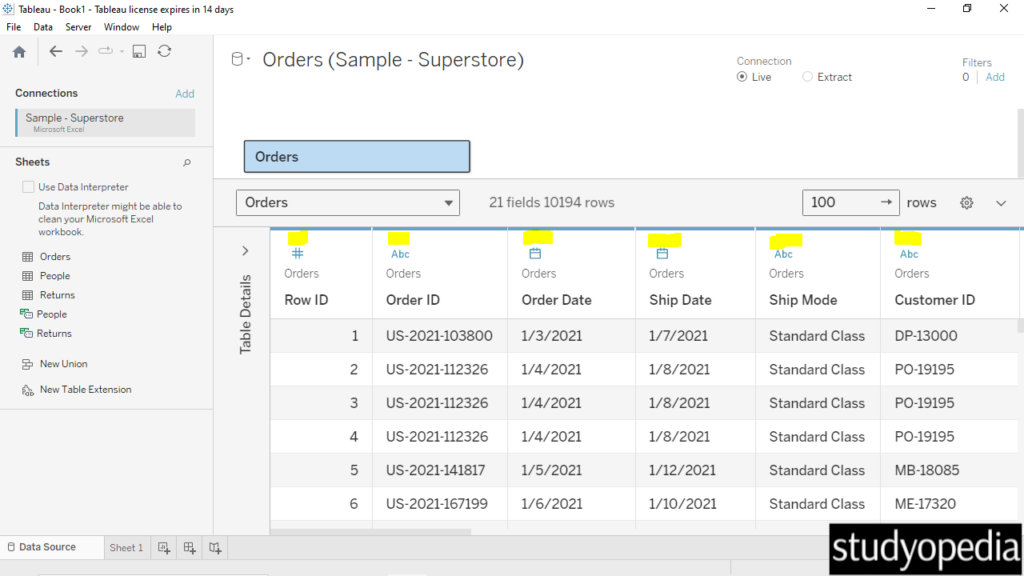
The number of rows and columns in the table is visible. In the text box, mention how many rows you want to display at a time. We entered 500 and pressed enter, and now 500 rows at a time are visible. Easily scroll down to view all the rows:
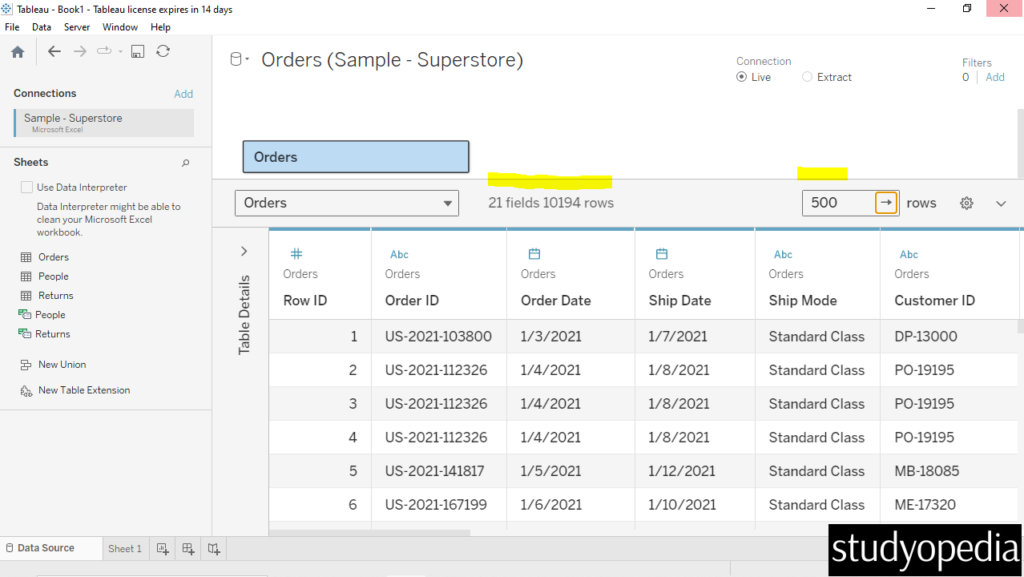
The Live and Extract option button is also visible under the Connection as shown above. What does that mean?
In Tableau, the choice between Live Connections and Data Extracts can significantly impact performance, data freshness, and overall user experience.
Live Connections
- Real-time Data: Changes in the data source are immediately reflected in Tableau.
- Resource Intensive: This can be slower, especially with large datasets, as it relies on the database for all queries.
- Network Dependency: Performance can be affected by network speed and traffic.
Data Extracts
- Faster Performance: Extracts are snapshots of data optimized for aggregation, leading to quicker load times.
- Offline Access: Extracts can be used without a continuous connection to the data source.
- Not Real-time: Changes in the data source are not reflected until the extract is refreshed.
If you liked the tutorial, spread the word and share the link and our website Studyopedia with others.
For Videos, Join Our YouTube Channel: Join Now
Read More:


No Comments