14 Mar Confusion Matrix in Machine Learning
The confusion matrix is a fundamental tool in model evaluation, especially for classification problems. It provides a detailed breakdown of a model’s predictions, helping you understand not just how often the model is correct, but also what kinds of mistakes it is making. Let’s explore its role in model evaluation and how it fits into the broader context of the lesson What is Model Evaluation.
Let us understand the role of the Confusion Matrix in Model Evaluation.
What is a Confusion Matrix
A confusion matrix is a table that summarizes the performance of a classification model by comparing the actual labels with the predicted labels. It is particularly useful for binary classification but can be extended to multi-class classification as well.
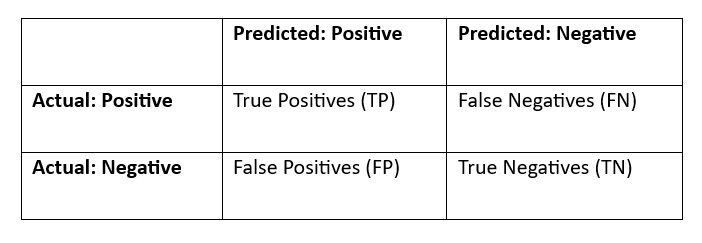
For a binary classification problem, the confusion matrix looks like this:
Why is the Confusion Matrix Important
The confusion matrix provides a deeper understanding of model performance beyond simple metrics like accuracy. Here’s why it’s crucial:
- Breaks Down Errors: It shows not just how many predictions are correct, but also what types of errors the model is making (e.g., false positives or false negatives).
- Supports Imbalanced Datasets: In cases where classes are imbalanced (e.g., fraud detection), accuracy can be misleading. The confusion matrix helps identify issues like high false negatives or false positives.
- Enables Calculation of Key Metrics: Many important evaluation metrics (e.g., precision, recall, F1-score) are derived directly from the confusion matrix.
How Does the Confusion Matrix Fit into Model Evaluation
In the lesson: What is ModelEvaluation?, the confusion matrix is introduced as a tool to diagnose model performance. Here’s how it fits into the broader evaluation process:
- Understanding Model Behavior:
- After training a model, you use the confusion matrix to analyze its predictions.
- For example, if a model is predicting whether an email is spam, the confusion matrix will show:
- How many spam emails were correctly identified (True Positives).
- How many legitimate emails were incorrectly flagged as spam (False Positives).
- How many spam emails were missed (False Negatives).
- How many legitimate emails were correctly identified (True Negatives).
- Identifying Strengths and Weaknesses:
- The confusion matrix helps you identify where the model is struggling.
- For example:
- High False Positives: The model is too aggressive in predicting the positive class.
- High False Negatives: The model is missing too many positive cases.
- Guiding Model Improvement:
- Based on the confusion matrix, you can take steps to improve the model:
- If False Positives are high, you might adjust the decision threshold or collect more data for the positive class.
- If False Negatives are high, you might focus on improving recall.
- Based on the confusion matrix, you can take steps to improve the model:
Real-World Example of Confusion Matrix
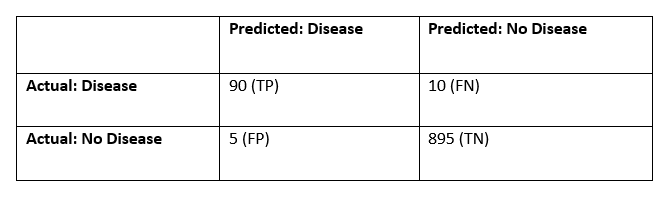
Let’s say you’re building a model to detect whether a patient has a disease (Positive) or not (Negative). The confusion matrix might look like this:
Let us understand the example:
- Insights:
- The model correctly identified 90 patients with the disease (True Positives).
- It missed 10 patients with the disease (False Negatives).
- It incorrectly flagged 5 healthy patients as having the disease (False Positives).
- It correctly identified 895 healthy patients (True Negatives).
- Actions:
- If missing patients (False Negatives) is critical, you might focus on improving recall.
- If false alarms (False Positives) are costly, you might focus on improving precision.
Connection to Evaluation Metrics
The confusion matrix is the foundation for many evaluation metrics:
- Accuracy: (TP + TN) / (TP + TN + FP + FN)
- Precision: TP / (TP + FP) – How many predicted positives are actually positive?
- Recall (Sensitivity): TP / (TP + FN) – How many actual positives were correctly predicted?
- F1-Score: Harmonic mean of precision and recall.
- Specificity: TN / (TN + FP) – How many actual negatives were correctly predicted?
Key Takeaways
- The confusion matrix is a powerful tool for understanding model performance in classification tasks.
- It breaks down predictions into True Positives, True Negatives, False Positives, and False Negatives.
- It helps diagnose model behavior, identify weaknesses, and guide improvements.
- It is the foundation for calculating key evaluation metrics like precision, recall, and F1-score.
If you liked the tutorial, spread the word and share the link and our website Studyopedia with others.
For Videos, Join Our YouTube Channel: Join Now
Read More:
- NLP Tutorial
- Generative AI Tutorial
- Machine Learning Tutorial
- Deep Learning Tutorial
- Ollama Tutorial
- Retrieval Augmented Generation (RAG) Tutorial
- Copilot Tutorial
- Gemini Tutorial
- ChatGPT Tutorial
No Comments