24 Sep Confusion Matrix in Machine Learning
Confusion Matrix measures the performance of machine learning classification algorithms. It includes two dimensions: Actual and Predicted. A detailed breakdown of the model’s predictions to the actual outcomes is displayed by a confusion matrix.
Structure of a confusion matrix
Consider the Confusion Matrix as a 2×2 table for binary classification. Rows show the actual classes, and columns show the predicted classes. The matrix has two rows and two columns:
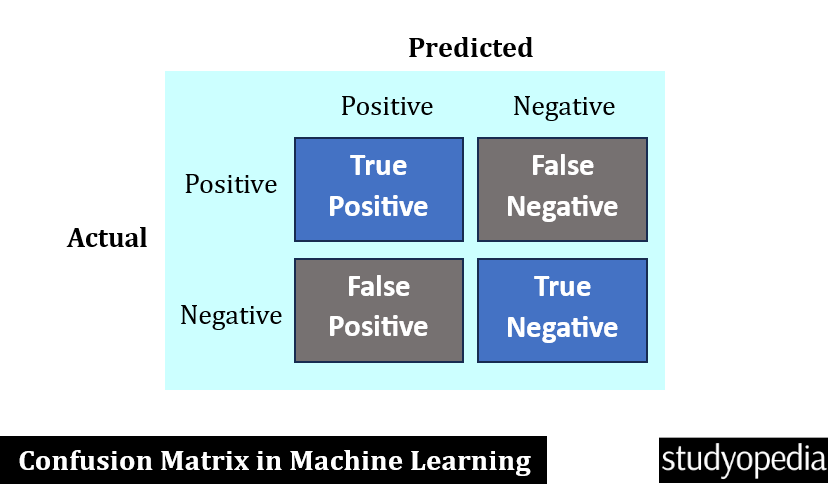
Table components in Confusion Matrix
A table in the confusion matrix includes the following components:
- True Positives (TP): The model correctly predicts the positive class (actual was true).
- True Negatives (TN): The model correctly predicts the negative class (actual was false).
- False Positives (FP): The model incorrectly predicts the positive class (actual was false).
- False Negatives (FN): The model incorrectly predicts the negative class (actual was true).
Metrics Derived from the Confusion Matrix
Several important metrics can be calculated from the confusion matrix:
- Accuracy: ((TP + TN) / (TP + TN + FP + FN))
It measures the model performance. - Precision: (TP / (TP + FP))
It measures the accuracy of the model’s positive predictions. - Recall (Sensitivity): (TP / (TP + FN))
It identifies relevant instances. - Specificity: (TN / (TN + FP))
It measures the model’s ability to identify negative instances.
If you liked the tutorial, spread the word and share the link and our website Studyopedia with others.
For Videos, Join Our YouTube Channel: Join Now
Read More:
No Comments