24 Jan Pandas – Cleaning the Data
To clean the data in Python, we have some built-in functions. In this lesson, we will understand them one by one with examples. Cleaning the data in Pandas means working on the incorrect data to fix it. This incorrect data can empty data, null, duplicate data, etc.
Read: Handle Duplicate Data in Pandas
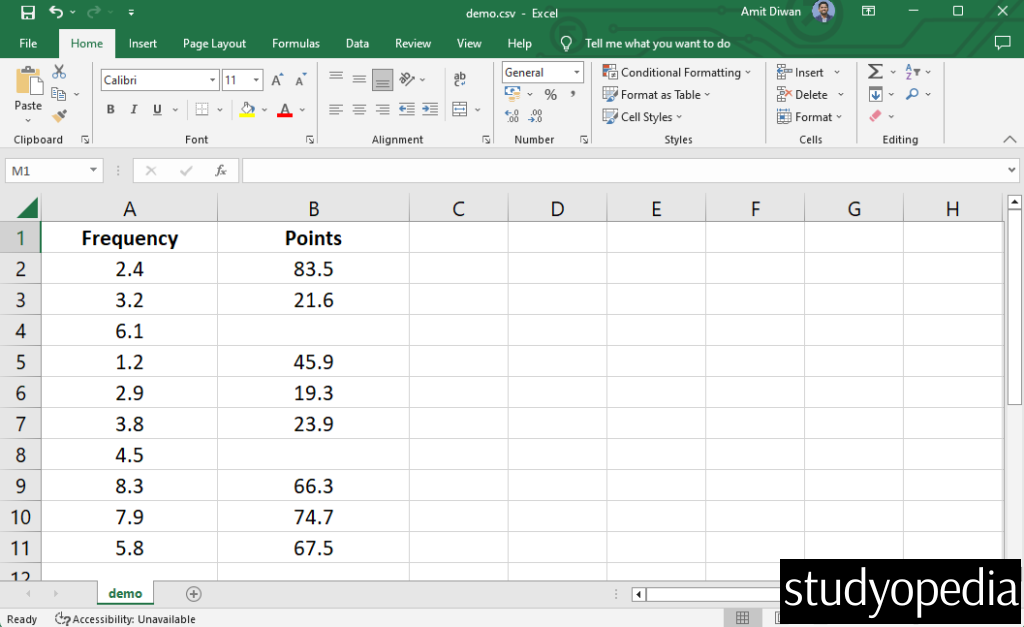
Let’s say we have the following CSV file demo.csv. The data consists of some null values:
Clean the data
Let us now work around the functions to clean the data:
- isnull(): Find the NULL values and replace them with True.
- notnull(): Find the NOT NULL values and replace them with True.
- df.dropna(): Drop rows with NULL values.
- df.fillna(x): Replace NULL values with a specific value
1. Pandas isnull() method
The isnull() method in Pandas is used to find the NULL values and replace them with True. For non-NULL values, False is returned. Let us see an example:
import pandas as pd

# Input CSV file
df = pd.read_csv(r"C:\Users\hp\Desktop\demo.csv")

# Display the CSV file records
print("Our DataFrame\n",df)

# Find and Replace Null with True
resdf = df.isnull()

# Return the new DataFrame
print("\nNew DataFrame \n",resdf.to_string())
Output
Our DataFrame
    Frequency  Points
0        2.4    83.5
1        3.2    21.6
2        6.1     NaN
3        1.2    45.9
4        2.9    19.3
5        3.8    23.9
6        4.5     NaN
7        8.3    66.3
8        7.9    74.7
9        5.8    67.5

New DataFrame
    Frequency  Points
0      False   False
1      False   False
2      False    True
3      False   False
4      False   False
5      False   False
6      False    True
7      False   False
8      False   False
9      False   False
2. Pandas notnull() method
The notnull() method in Pandas is used to find the NOT NULL values and replace them with True. For NULL values, False is returned. Let us see an example:
import pandas as pd

# Input CSV file
df = pd.read_csv(r"C:\Users\hp\Desktop\demo.csv")

# Display the CSV file records
print("Our DataFrame\n",df)

# Find and Replace NOT NULL values with True
resdf = df.notnull()

# Return the new DataFrame
print("\nNew DataFrame\n",resdf.to_string())
Output
Our DataFrame
    Frequency  Points
0        2.4    83.5
1        3.2    21.6
2        6.1     NaN
3        1.2    45.9
4        2.9    19.3
5        3.8    23.9
6        4.5     NaN
7        8.3    66.3
8        7.9    74.7
9        5.8    67.5

New DataFrame
    Frequency  Points
0       True    True
1       True    True
2       True   False
3       True    True
4       True    True
5       True    True
6       True   False
7       True    True
8       True    True
9       True    True
3. Pandas dropna() method
The dropna() method in Pandas removes rows with null values. Let us see an example:
import pandas as pd

# Input CSV file
df = pd.read_csv(r"C:\Users\hp\Desktop\demo.csv")

# Display the CSV file records
print("Our DataFrame\n",df)

# Find and remove rows with NULL value
resdf = df.dropna()

# Return the new DataFrame
print("\nNew DataFrame (after removing rows with NULL)\n",resdf.to_string())
Output
Our DataFrame
    Frequency  Points
0        2.4    83.5
1        3.2    21.6
2        6.1     NaN
3        1.2    45.9
4        2.9    19.3
5        3.8    23.9
6        4.5     NaN
7        8.3    66.3
8        7.9    74.7
9        5.8    67.5

New DataFrame (after removing rows with NULL)
    Frequency  Points
0        2.4    83.5
1        3.2    21.6
3        1.2    45.9
4        2.9    19.3
5        3.8    23.9
7        8.3    66.3
8        7.9    74.7
9        5.8    67.5
4. Pandas fillna() method
The fillna() method in Pandas is used to replace NULL values with a specific value. Let us see an example:
import pandas as pd

# Input CSV file
df = pd.read_csv(r"C:\Users\hp\Desktop\demo.csv")

# Display the CSV file records
print("Our DataFrame\n",df)

# Find and replace NULL values with a specific value 111
resdf = df.fillna(111)

# Return the new DataFrame
print("\nNew DataFrame (after replacing NULL with a specific value)\n",resdf.to_string())
Output
Our DataFrame
    Frequency  Points
0        2.4    83.5
1        3.2    21.6
2        6.1     NaN
3        1.2    45.9
4        2.9    19.3
5        3.8    23.9
6        4.5     NaN
7        8.3    66.3
8        7.9    74.7
9        5.8    67.5

New DataFrame (after replacing NULL with a specific value)
    Frequency  Points
0        2.4    83.5
1        3.2    21.6
2        6.1   111.0
3        1.2    45.9
4        2.9    19.3
5        3.8    23.9
6        4.5   111.0
7        8.3    66.3
8        7.9    74.7
9        5.8    67.5
Techniques for imputing or masking data
Here are specific techniques for imputing or masking data, which allow you to handle missing values without simply deleting them.
Imputation is the process of replacing missing or NULL values with “educated guesses” to keep your dataset complete. It is a critical step in data cleaning because many machine learning models cannot process data with gaps.
-
- Goal: To improve data quality and prevent the loss of valuable information that would occur if you simply deleted every row with a missing value.
- Common Techniques:
-
- Mean/Median/Mode: Filling gaps with the average or most frequent value.
- Forward/Backward Fill: Using the previous or next available value, often used in time-series data.
- K-Nearest Neighbors (KNN): Using similar data points to predict the missing value.
-
- Goal: To protect Personally Identifiable Information (PII) and comply with privacy laws like GDPR or HIPAA.
- Common Techniques:
- Substitution: Replacing real names with random fake names from a list.
- Shuffling: Swapping values between rows (e.g., mixing up all phone numbers in a column so they no longer match the correct person).
- Redaction (Masking Out): Replacing characters with symbols, such as showing only the last four digits of a credit card:
XXXX-XXXX-XXXX-1234
Let us now see some examples:
- Find the NULL values and replace only NULL with True
- Replace NULL values with a specific string value
- Fill every numeric column’s NaN values with its respective column mean
- Fill missing values in only one column with its mean
- Fix the date formats
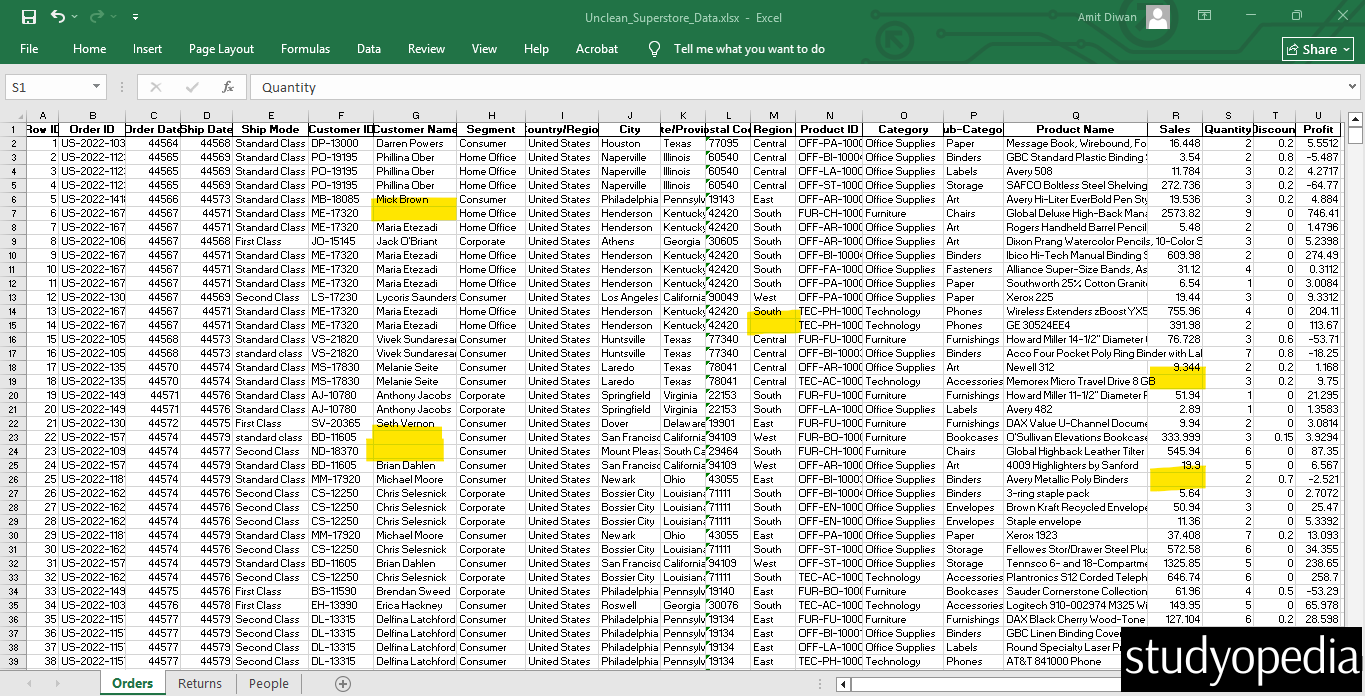
Our data is now an Excel file with unclean data. The file name path is the following:
C:\Users\hp\Desktop\Unclean_Superstore_Data.xlsx
Here is the screenshot of the Excel file. We have marked some NULL values from the unclean excel file:
Let us now see the examples one by one:
5. Find the NULL values and replace only NULL with True
We will find only the NULL values and replace only NULL with TRUE using where(). Let us see an example:
# Find the NULL values and replace only NULL with True

import pandas as pd

# input excel file
# Load the excel in the DataFrame
# df = pd.read_excel('C:\\Users\\hp\\Desktop\\Unclean_Superstore_Data.xlsx')
df = pd.read_excel(r'C:\Users\hp\Desktop\Unclean_Superstore_Data.xlsx')

print("Our DataFrame =\n",df)

# Find the null values and replace it with TRUE
res = df.isnull().where(df.isnull(), df)

print(res.to_string())

# To export the result in a new excel file, use the toexcel() method
# The to_excel() will write the updated dataframe into the excel
res.to_excel(r'C:\Users\hp\Desktop\Demo.xlsx')

print("\n-- Resultant DataFrame exported to Demo.xlsx excel file")
Output
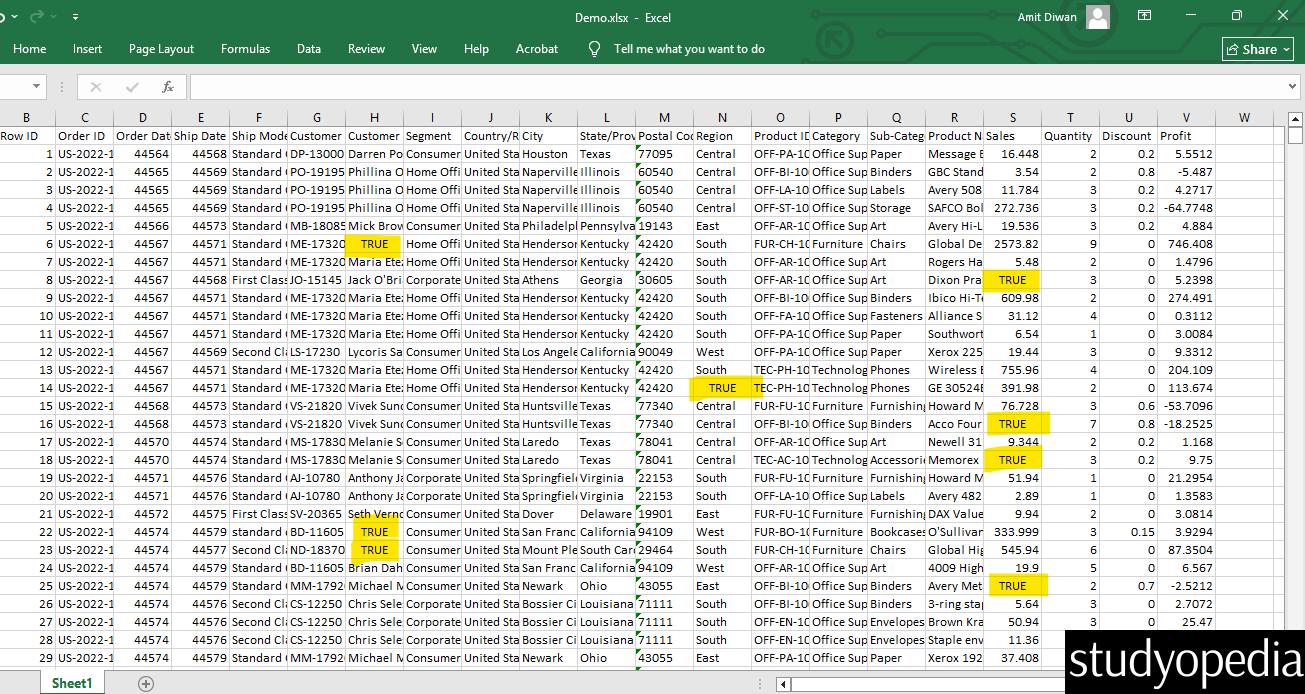
Above, we have marked the cells replaced with True because those were NULL values. The dataframe output was exported to Demo.xlsx using the to_excel() method in Pandas. Therefore, a new excel file Demo.xlsx generated as output.
6. Replace NULL values with a specific string value
This is useful for categorical columns where you want to label missing data as “Missing” or “Unknown” instead of leaving it blank. Follow the syntax:
df.fillna("Your String Here
Let us now see an example:
# Replace NULL values with a specific string value

import pandas as pd

# input excel file
# Load the excel in the DataFrame
# df = pd.read_excel('C:\\Users\\hp\\Desktop\\Unclean_Superstore_Data.xlsx')
df = pd.read_excel(r'C:\Users\hp\Desktop\Unclean_Superstore_Data.xlsx')

print("Our DataFrame =\n",df)

# Find and replace NULL values with a specific value "Missing"
res = df.fillna("Missing")

# To export the result in a new excel file, use the toexcel() method
# The to_excel() will write the updated dataframe into the excel
res.to_excel(r'C:\Users\hp\Desktop\Demo2.xlsx')

print("\n-- Resultant DataFrame exported to Demo2.xlsx excel file")
Output
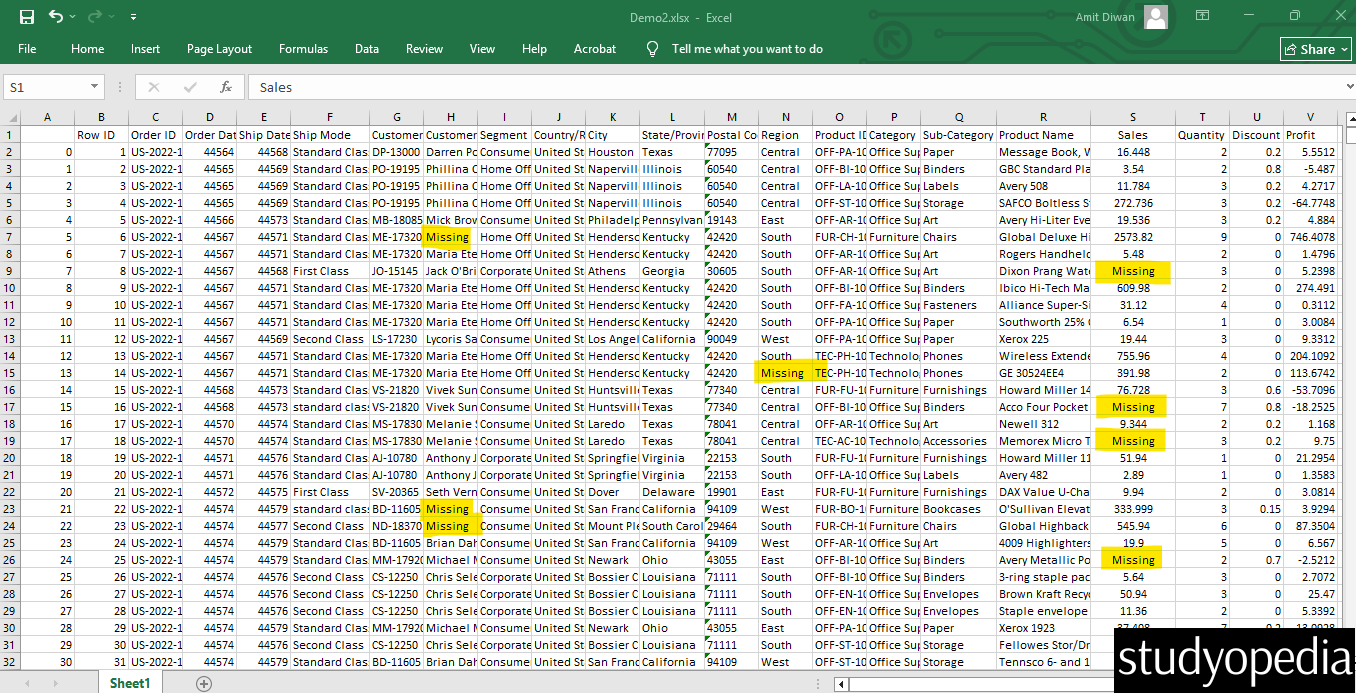
Above, we have marked the cells replaced with “b” because those were NULL values. The dataframe output was exported to Demo2.xlsx using the to_excel() method in Pandas. Therefore, a new excel file Demo2.xlsx generated as output.
7. Fill every numeric column’s NaN values with its respective column mean
This is a common statistical fix. It calculates the average for each numeric column and fills its specific gaps with that average. We will use the numeric_only value of the mean():
Let us see an example:
# Fill every numeric column's NaN values with its respective column mean

import pandas as pd

# input excel file
# Load the excel in the DataFrame
# df = pd.read_excel('C:\\Users\\hp\\Desktop\\Unclean_Superstore_Data.xlsx')
df = pd.read_excel(r'C:\Users\hp\Desktop\Unclean_Superstore_Data.xlsx')

print("Our DataFrame =\n",df)

# Fill every numeric column with its respective column mean
res = df.fillna(df.mean(numeric_only=True))

# To export the result in a new excel file, use the toexcel() method
# The to_excel() will write the updated dataframe into the excel
res.to_excel(r'C:\Users\hp\Desktop\Demo3.xlsx')

print("\n-- Resultant DataFrame exported to Demo3.xlsx excel file")
Output
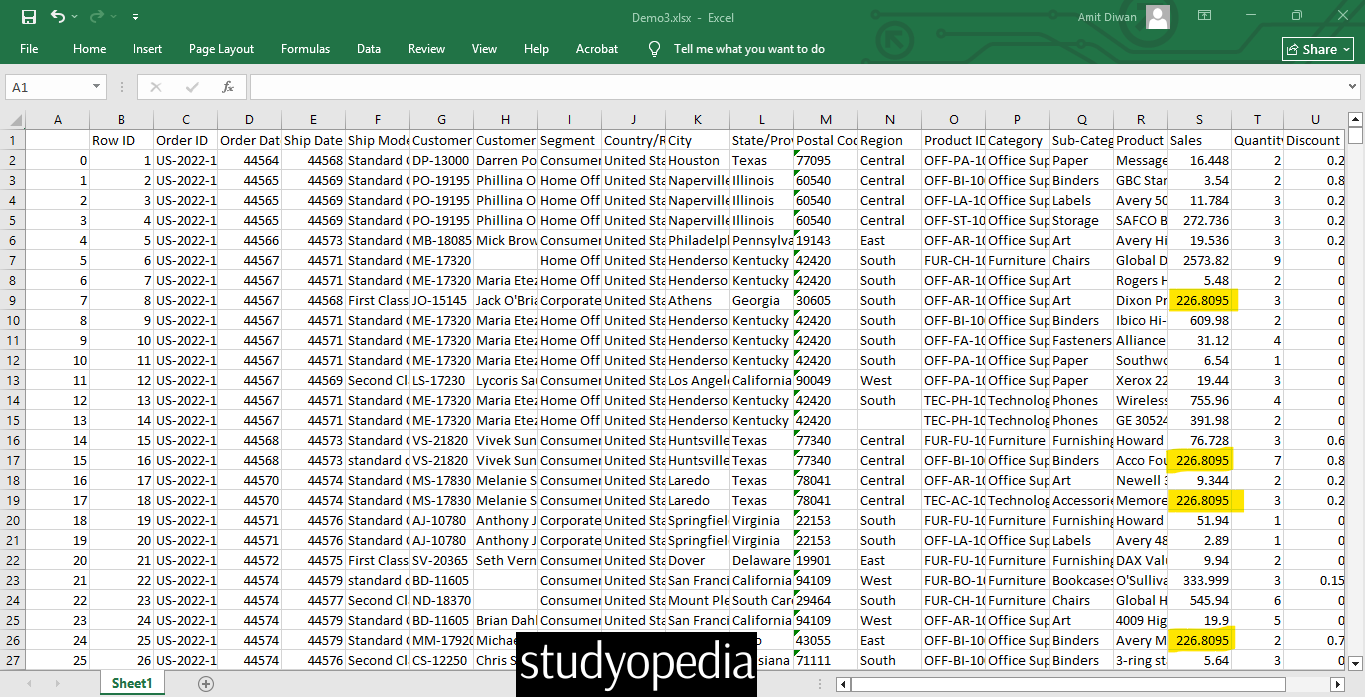
Above, we have marked the cells replaced with the mean of their respective columns because those were NULL values (in a numeric column). The dataframe output was exported to Demo3.xlsx using the to_excel() method in Pandas. Therefore, a new Excel file, Demo3.xlsx, was generated as output.
Only one numeric column, Sales, had missing values. The above would have implemented the same for any other numeric columns with missing values.
8. Fill missing values in only one column with its mean
Calculate the average for a specific numeric column and fill its specific gaps with that average. Above, we saw how to calculate the average for each numeric column and fill its specific gaps with that average.
# Fill missing values in only one column with its mean

import pandas as pd

# input excel file
# Load the excel in the DataFrame
# df = pd.read_excel('C:\\Users\\hp\\Desktop\\Unclean_Superstore_Data.xlsx')
df = pd.read_excel(r'C:\Users\hp\Desktop\Unclean_Superstore_Data.xlsx')

print("Our DataFrame =\n",df)

# Fill missing values in only one column with its mean
res = df['Sales'].fillna(df['Sales'].mean())
print("Our DataFrame =\n",res)

# To export the result in a new excel file, use the toexcel() method
# The to_excel() will write the updated dataframe into the excel
res.to_excel(r'C:\Users\hp\Desktop\Demo4.xlsx')

print("\n-- Resultant DataFrame exported to Demo4.xlsx excel file")
Output
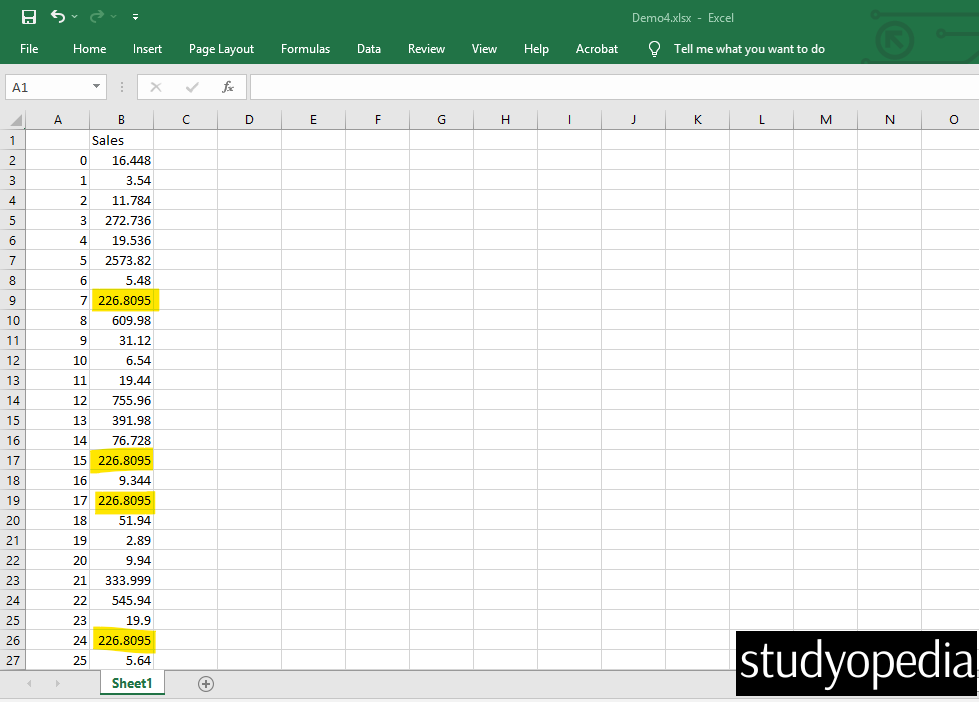
Above, we have marked the cells replaced with the mean of the Sales column because those were NULL values (in only a single column). The dataframe output was exported to Demo4.xlsx using the to_excel() method in Pandas. Therefore, a new Excel file, Demo3.xlsx, was generated as output.
Use this when you only want to fix one specific column (like “Sales“) while leaving others untouched.
9. Fix the date formats
In Excel, dates are often stored as numbers (e.g., 44564). Excel stores dates as the number of days elapsed since January 1, 1990. Therefore, the number 44564, represents the 44564th day after January 1, 1900.
We need to convert these into a readable YYYY-MM-DD format. In our Unclean_Superstore_Data.xlsx, the date formats are stored as numbers, as shown below:
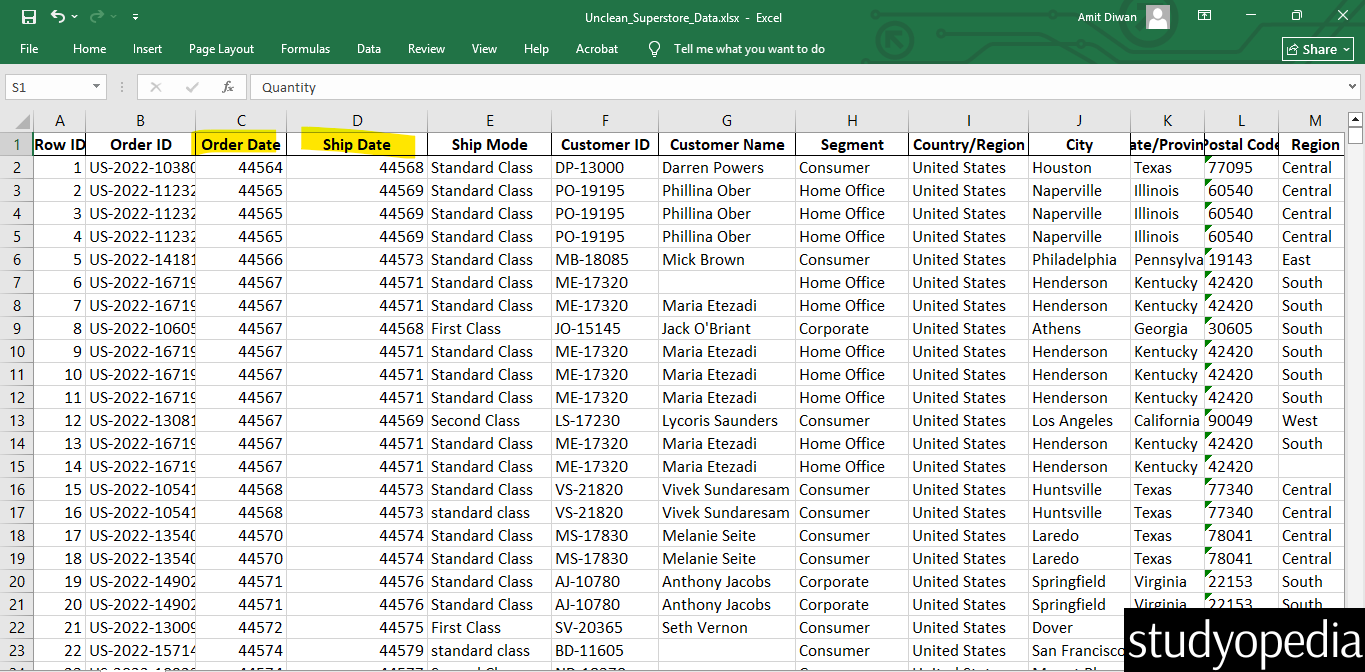
Let’s see how to fix:
# Fix date formats

import pandas as pd

# input excel file
# Load the excel in the DataFrame
# df = pd.read_excel('C:\\Users\\hp\\Desktop\\Unclean_Superstore_Data.xlsx')
df = pd.read_excel(r'C:\Users\hp\Desktop\Unclean_Superstore_Data.xlsx')

print("Our DataFrame =\n",df)

# Convert Excel serial numbers to datetime objects
# The origin '1899-12-30' is the standard for Excel-to-Pandas conversion
df['Order Date'] = pd.to_datetime(df['Order Date'], unit='D', origin='1899-12-30')
df['Ship Date'] = pd.to_datetime(df['Ship Date'], unit='D', origin='1899-12-30')

print("Our Updated DataFrame =\n",df)

# To export the result in a new excel file, use the to_excel() method
# The to_excel() will write the updated dataframe into the excel
df.to_excel(r'C:\Users\hp\Desktop\Demo5.xlsx')

print("\n-- Resultant DataFrame exported to Demo5.xlsx excel file")
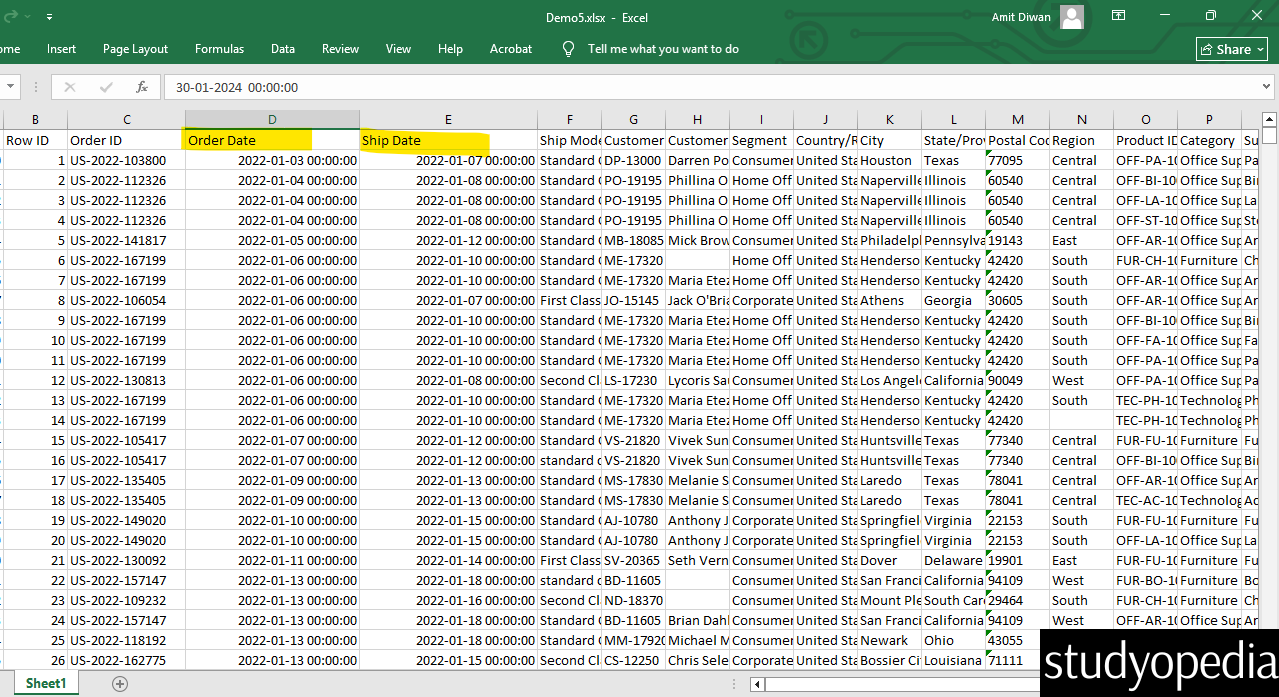
Output
The updated dataframe gets exported in Demo5.xlsx because we have used the dataframe.to_excel():
If you liked the tutorial, spread the word and share the link and our website, Studyopedia, with others:
For Videos, Join Our YouTube Channel: Join Now
Read More:
No Comments