26 Oct Read Excel in Python Pandas
To read an Excel file in Python, we use the Pandas read_excel() method. We load an Excel file into the DataFrame. Therefore, our data/ input here is our Excel file.
We will read an Excel and handle our dataset like this:
-
- Read an Excel in Pandas: Uses the pd.read_excel() function.
- Read a specific sheet: Accomplished via the
sheet_nameparameter in the read_excel method. - Read by skipping rows: Uses the
skiprowsparameter during the file reading process.
-
- Display top/last n rows: Uses the .head() and
.tail()methods. - Display column names: Uses the
.columnsattribute. - Select/retrieve rows/columns: Techniques like label-based indexing (.loc) and position-based indexing (.iloc) allow for precise data selection
- Display top/last n rows: Uses the .head() and
-
- Filter data based on conditions: Uses boolean indexing to isolate specific rows.
- Add a new column: Involves assigning new data to a new or existing column name.
- Export to Excel: Uses the .to_excel() method to save the final modified DataFrame back to a file.
Examples
Let us now implement the following examples to read and work with an Excel file in Pandas:
- Read an Excel in Pandas
- Read a specific sheet from an Excel File
- Display the top n rows of the DataFrame
- Display the last n rows of a DataFrame
- Display only the column names
- Read a specific column from the DataFrame
- Read a single/ multiple columns
- Read by skipping rows from a DataFrame
- Read a specific column with the indexing operator
- Read multiple columns with the indexing operator
- Label-based indexing with loc to retrieve a single row
- Retrieve a specific cell (row+column) with loc
- Position-based indexing with iloc to retrieve a single row
- Select multiple columns in a range using the columns attribute
- Filter data (specific rows) based on a condition
- Add a new column to our dataframe
- Export (Save) a DataFrame into an Excel file
Before beginning with the examples, first, install the openpyxl package using pip. Type the following command to install openpyxl:
pip install openpyxl
Before moving further, we’ve prepared a video tutorial on reading an Excel file in Pandas:
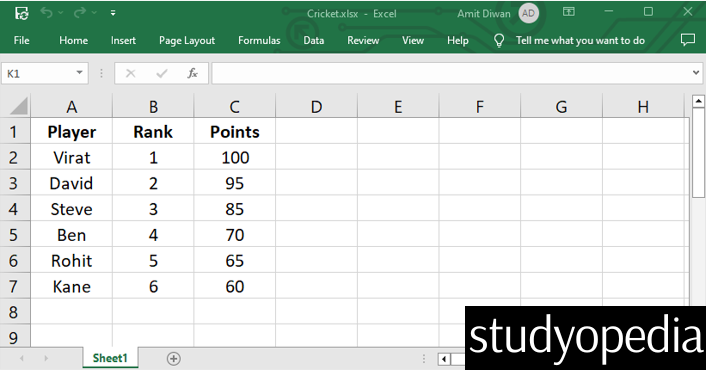
Let’s say we have the following Excel file Cricket.xlsx:
Let us begin with the examples:
1. Read an Excel in Pandas
Let us now see an example to read our Excel file Cricket.xlsx using the pandas.read_excel() method in Pandas. First, load the Excel file, read the data, and store it in a Pandas DataFrame:
import pandas as pd

# Input Excel File
# Load the Excel in the DataFrame
# You can also set the path like this: ('C:\\Users\\hp\\Desktop\\Cricket.xlsx')
dataFrame = pd.read_excel(r'C:\Users\hp\Desktop\Cricket.xlsx')

# Display the Excel file records
print("Our DataFrame =\n", dataFrame)
Output
Our DataFrame =
   Player  Rank  Points
0  Virat     1     100
1  David     2      95
2  Steve     3      85
3    Ben     4      70
4  Rohit     5      65
5   Kane     6      60
The above reads the first sheet by default
2. Read a specific sheet from an Excel File
To read specific sheets from an Excel file using pandas.read_excel() function, use the sheet_name parameter. We can pass either the sheet name or an index:
Read a sheet with the name Orders:
df = pd.read_excel('file.xlsx', sheet_name='Orders')
Reads the second sheet using index 1:
df = pd.read_excel('file.xlsx', sheet_name=1)
Return a dictionary containing every sheet in the workbook:
all_sheets = pd.read_excel('file.xlsx', sheet_name=None)
3. Display the top n rows of the DataFrame
The head() method will display the first n rows of a DataFrame. The default rows returned are 5.
Let us see an example to display only the top 2 rows. For that, set the parameter of the head() as 2. First, load the Excel file, read the data, and store it in a Pandas DataFrame:
import pandas as pd

# Input Excel File
# Load the Excel in the DataFrame
# You can also set the path like this: ('C:\\Users\\hp\\Desktop\\Cricket.xlsx')
dataFrame = pd.read_excel(r'C:\Users\hp\Desktop\Cricket.xlsx')

# Display the Excel file records
print("Our DataFrame =\n", dataFrame)

print("\nDisplay top 2 rows =\n",dataFrame.head(2))
Output
Our DataFrame =
   Player  Rank  Points
0  Virat     1     100
1  David     2      95
2  Steve     3      85
3    Ben     4      70
4  Rohit     5      65
5   Kane     6      60

Display top 2 rows =
   Player  Rank  Points
0  Virat     1     100
1  David     2      95
4. Display the last n rows of a DataFrame
The tail() method will display the last n rows of a DataFrame. The default rows returned are 5.
Let us see an example to display only the bottom 2 rows. For that, set the parameter of the tail() as 2. First, load the Excel file, read the data, and store it in a Pandas DataFrame:
import pandas as pd

# Input Excel File
# Load the Excel in the DataFrame
# You can also set the path like this: ('C:\\Users\\hp\\Desktop\\Cricket.xlsx')
dataFrame = pd.read_excel(r'C:\Users\hp\Desktop\Cricket.xlsx')

# Display the Excel file records
print("Our DataFrame =\n", dataFrame)

print("\nDisplay last 2 rows =\n",dataFrame.tail(2))
Output
Our DataFrame =
   Player  Rank  Points
0  Virat     1     100
1  David     2      95
2  Steve     3      85
3    Ben     4      70
4  Rohit     5      65
5   Kane     6      60

Display last 2 rows =
   Player  Rank  Points
4  Rohit     5      65
5   Kane     6      60
5. Display only the column names from the DataFrame
To display only the column names, use the columns attribute of the Pandas DataFrame:
import pandas as pd

# Input excel file
# Load the excel in the DataFrame
# You can also set the path like this: ('C:\\Users\\hp\\Desktop\\Cricket.xlsx')
df = pd.read_excel(r’C:\Users\hp\Desktop\Cricket.xlsx’)
print(“Our DataFrame =\n”,df)
# Display only the column names
print(“\nColumns =\n”,df.columns)
Output
Our DataFrame =
    Player  Rank  Points
0   Virat     1     100
1  Dravid     2      95
2   Steve     3      85
3     Ben     4      70
4   Rohit     5      65
5    Kane     6      60

Columns =
 Index(['Player', 'Rank', 'Points'], dtype='str')
6. Read a specific column from the DataFrame
import pandas as pd

# Input excel file
# Load the excel in the DataFrame
# You can also set the path like this: ('C:\\Users\\hp\\Desktop\\Cricket.xlsx')
df = pd.read_excel(r'C:\Users\hp\Desktop\Cricket.xlsx')

print("Our DataFrame =\n",df)

# Read a specific column
print("\nReading the player column =\n",df['Player'])
Output
Our DataFrame =
    Player  Rank  Points
0   Virat     1     100
1  Dravid     2      95
2   Steve     3      85
3     Ben     4      70
4   Rohit     5      65
5    Kane     6      60

Reading the player column =
 0     Virat
1    Dravid
2     Steve
3       Ben
4     Rohit
5      Kane
Name: Player, dtype: str
7. Read a single/ multiple columns from a DataFrame
To read a single column, we can also use the usecols parameter of the read_excel() method. Let us see an example:
import pandas as pd

# Input excel file
# Load the excel in the DataFrame
# You can also set the path like this: ('C:\\Users\\hp\\Desktop\\Cricket.xlsx')
# Read a column
df = pd.read_excel(r'C:\Users\hp\Desktop\Cricket.xlsx', usecols=["Points"])
print("\nReading only a single column =\n",df)
Output
Reading only a single column =
    Points
0     100
1      95
2      85
3      70
4      65
5      60
To read multiple columns, use the usecols parameter of the read_excel() method. Set multiple columns, like: usecols=[“Rank”, “Points”]. Let us see an example:
import pandas as pd

# Input excel file
# Load the excel in the DataFrame
# You can also set the path like this: ('C:\\Users\\hp\\Desktop\\Cricket.xlsx')
# Read multiple columns
df = pd.read_excel(r'C:\Users\hp\Desktop\Cricket.xlsx', usecols=["Rank", "Points"])
print("\nReading multiple columns =\n",df)
Output
Reading multiple columns =
    Rank  Points
0     1     100
1     2      95
2     3      85
3     4      70
4     5      65
5     6      60
8. Read by skipping rows from a DataFrame
To skip rows while reading an Excel, use the skiprows parameter of the read_excel() method. Let us see an example:
import pandas as pd

# Input excel file
# Load the excel in the DataFrame
# You can also set the path like this: ('C:\\Users\\hp\\Desktop\\Cricket.xlsx')
# Read by skipping rows
df = pd.read_excel(r'C:\Users\hp\Desktop\Cricket.xlsx', skiprows=3)
print("\nReading skipping the first 3 rows =\n",df)
Output
Reading skipping the first 3 rows =
    Steve  3  85
0    Ben  4  70
1  Rohit  5  65
2   Kane  6  60
9. Read a specific column with the indexing operator from the DataFrame
Use the indexing operator [] to read a specific column. Let us see an example:
# Indexing in Pandas using the indexing operator

import pandas as pd

# input excel file
# Load the excel in the DataFrame
# You can also set the path like this: ('C:\\Users\\hp\\Desktop\\Cricket.xlsx')
df = pd.read_excel(r'C:\Users\hp\Desktop\Cricket.xlsx')

print("Our DataFrame =\n",df)

# Indexing operator
res = df["Player"]
print("\nPlayer Names =\n",res)
Output
Our DataFrame =
    Player  Rank  Points
0   Virat     1     100
1  Dravid     2      95
2   Steve     3      85
3     Ben     4      70
4   Rohit     5      65
5    Kane     6      60

Player Names =
 0     Virat
1    Dravid
2     Steve
3       Ben
4     Rohit
5      Kane
Name: Player, dtype: str
10. Read multiple columns with the indexing operator from a DataFrame
Read multiple columns using the indexing operator [] by passing a list of column names inside the brackets. This requires double square brackets:
- The outer brackets are the indexing operator.
- The inner brackets create the Python list containing the column names.
Let us see an example:
# Read a specific column with the indexing operator

import pandas as pd

# input excel file
# Load the excel in the DataFrame
# You can also set the path like this: ('C:\\Users\\hp\\Desktop\\Cricket.xlsx')
df = pd.read_excel(r'C:\Users\hp\Desktop\Cricket.xlsx')

print("Our DataFrame =\n",df)

# Select multiple columns
print(df[['Player','Points']])
Output
Our DataFrame =
    Player  Rank  Points
0   Virat     1     100
1  Dravid     2      95
2   Steve     3      85
3     Ben     4      70
4   Rohit     5      65
5    Kane     6      60
   Player  Points
0   Virat     100
1  Dravid      95
2   Steve      85
3     Ben      70
4   Rohit      65
5    Kane      60
11. Label-based indexing with loc to retrieve a single row from the DataFrame
Use the loc indexing operator to retrieve a single row, with loc[0], loc[1], etc., but it is not preferred to use when a column is set as an index.
Therefore, in the example below, we will first set a column as an index using the use index_col parameter of the read_excel() method:
# Indexing in Pandas using loc[]

import pandas as pd

# input excel file
# Load the excel in the DataFrame
# We have set a column as an index
# You can also set the path like this: ('C:\\Users\\hp\\Desktop\\Cricket.xlsx')
df = pd.read_excel(r'C:\Users\hp\Desktop\Cricket.xlsx', index_col="Player")

print("Our DataFrame =\n",df)

# Retrieve a single row
print("\n",df.loc['Virat'])
Output
Our DataFrame =
         Rank  Points
Player
Virat      1     100
Dravid     2      95
Steve      3      85
Ben        4      70
Rohit      5      65
Kane       6      60

 Rank        1
Points    100
Name: Virat, dtype: int64
12. Retrieve a specific cell (row + column) with loc
Let us see an example to retrieve a specific cell with the loc operator:
import pandas as pd

# input excel file
# Load the excel in the DataFrame
# df = pd.read_excel('C:\\Users\\hp\\Desktop\\Cricket.xlsx')
df = pd.read_excel(r'C:\Users\hp\Desktop\Cricket.xlsx', index_col="Player")

print("Our DataFrame =\n",df)

# Fetch a specific cell (row + column)
print("\n",df.loc['Virat','Points'])
Output
Our DataFrame =
         Rank  Points
Player
Virat      1     100
Dravid     2      95
Steve      3      85
Ben        4      70
Rohit      5      65
Kane       6      60

 100
13. Position-based indexing with iloc to retrieve a single row from the DataFrame
To retrieve records by position, use the iloc operator in Pandas. Let us see an example to retrieve the record of the 3rd row:
# Indexing in Pandas using iloc[]

import pandas as pd

# input excel file
# Load the excel in the DataFrame
# You can also set the path like this: ('C:\\Users\\hp\\Desktop\\Cricket.xlsx')
df = pd.read_excel(r'C:\Users\hp\Desktop\Cricket.xlsx', index_col="Player")

print("Our DataFrame =\n",df)

# Retrieving the 3rd record
print("\n",df.iloc[2])
Output
Our DataFrame =
         Rank  Points
Player
Virat      1     100
Dravid     2      95
Steve      3      85
Ben        4      70
Rohit      5      65
Kane       6      60

 Rank       3
Points    85
Name: Steve, dtype: int64
14. Select multiple columns in a range using the columns attribute
Use the columns to select and display multiple columns in a range. For example, the command print(df[df.columns[0:2]]) is used to select and display the first two columns of a DataFrame.
Let us see an example:
# Select multiple columns in a range using the columns attribute

import pandas as pd

# input excel file
# Load the excel in the DataFrame
# You can also set the path like this: ('C:\\Users\\hp\\Desktop\\Cricket.xlsx')
df = pd.read_excel(r'C:\Users\hp\Desktop\Cricket.xlsx')

print("Our DataFrame =\n",df)

# Select multiple columns

# Select multiple columns in a range using
print(df[df.columns[0:2]])
Output
Our DataFrame =
    Player  Rank  Points
0   Virat     1     100
1  Dravid     2      95
2   Steve     3      85
3     Ben     4      70
4   Rohit     5      65
5    Kane     6      60

   Player  Rank
0   Virat     1
1  Dravid     2
2   Steve     3
3     Ben     4
4   Rohit     5
5    Kane     6
15. Filter data (specific rows) based on a condition
To filter and display the data from specific rows, set the condition in the square brackets, like: print(df[df[“Points”] > 70])
Let us perform Boolean indexing to select and print only the rows where the value in the Points column is strictly greater than 70:
# Filter data (specific rows) based on a condition
import pandas as pd

# input excel file
# Load the excel in the DataFrame
# You can also set the path like this: ('C:\\Users\\hp\\Desktop\\Cricket.xlsx')
df = pd.read_excel(r'C:\Users\hp\Desktop\Cricket.xlsx')
print("Our DataFrame =\n",df)

# Filter specific rows from a DataFrame
print(df[df["Points"] > 70])
Output
Our DataFrame =
    Player  Rank  Points
0   Virat     1     100
1  Dravid     2      95
2   Steve     3      85
3     Ben     4      70
4   Rohit     5      65
5    Kane     6      60

   Player  Rank  Points
0   Virat     1     100
1  Dravid     2      95
2   Steve     3      85
16. Add a new column to our dataframe
To add a new column at a specific position in a pandas DataFrame, use the pandas.DataFrame.insert() method. Unlike standard assignment, which appends columns to the end, insert() allows for precise placement and modifies the DataFrame in-place. The following are the key parameters:
- loc (int): The 0-based integer index where the column will be placed.
- column (str): The label for the new column.
- value (scalar or array-like): The data to insert. If a single value is provided (like 100), it is broadcasted to all rows.
# Add a new column to our dataframe and display the updated DataFrame

import pandas as pd

# input excel file
# Load the excel in the DataFrame
# You can also set the path like this: ('C:\\Users\\hp\\Desktop\\Cricket.xlsx')
df = pd.read_excel(r'C:\Users\hp\Desktop\Cricket.xlsx')

print("Our DataFrame =\n",df)

# Add a new column "WorldCupQualification" to the dataframe with a default value of 100
# A new column added at index 3
# The new column name is "WorldCupQualification"
# The default value for the new column is set to "Qualified"
df.insert(3, "WorldCupQualification", "Qualified")

print("\nUpdated DataFrame =\n",df)
Output
Our DataFrame =
    Player  Rank  Points
0   Virat     1     100
1  Dravid     2      95
2   Steve     3      85
3     Ben     4      70
4   Rohit     5      65
5    Kane     6      60

Updated DataFrame =
    Player  Rank  Points WorldCupQualification
0   Virat     1     100             Qualified
1  Dravid     2      95             Qualified
2   Steve     3      85             Qualified
3     Ben     4      70             Qualified
4   Rohit     5      65             Qualified
5    Kane     6      60             Qualified
17. Export (Save) a DataFrame into an Excel file
The pandas to_excel() method is used to export a DataFrame or Series into an Excel file (.xlsx or .xls). The following are the key parameters:
- index=False: Prevents pandas from writing the row index (0, 1, 2…) as a separate column in the Excel
- sheet_name=’Sheet1′: Allows you to name the worksheet (default is “Sheet1”).
Note: To use to_excel(), you must have an engine installed in your Python environment. For .xlsx files, it is recommended to use openpyxl. We already installed openpyxl to read an Excel file as shown at the beginning of the lesson.
Let us see an example:
# Add a new column to our dataframe and display the updated DataFrame
import pandas as pd
# input excel file
# Load the excel in the DataFrame
# You can also set the path like this: ('C:\\Users\\hp\\Desktop\\Cricket.xlsx')
df = pd.read_excel(r'C:\Users\hp\Desktop\Cricket.xlsx')
print("Our DataFrame =\n",df)
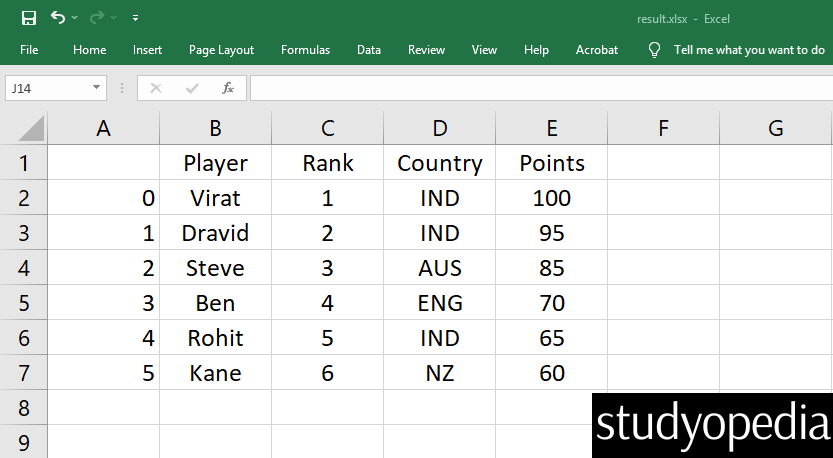
# Add a new column "Country" at index 3.
# We have also set the country values for the new column
df.insert(2, "Country", ['IND', 'IND', 'AUS', 'ENG', 'IND', 'NZ'])
print("\nUpdated Dataframe =\n",df)
# To export the result in a new excel file, use the toexcel() method
# The to_excel() will write the updated dataframe into the excel
df.to_excel(r'C:\Users\hp\Desktop\result.xlsx')
print("\n-- Resultant DataFrame exported to result.xls excel file")
Output
Our DataFrame =
    Player  Rank  Points
0   Virat     1     100
1  Dravid     2      95
2   Steve     3      85
3     Ben     4      70
4   Rohit     5      65
5    Kane     6      60

Updated Dataframe =
    Player  Rank Country  Points
0   Virat     1     IND     100
1  Dravid     2     IND      95
2   Steve     3     AUS      85
3     Ben     4     ENG      70
4   Rohit     5     IND      65
5    Kane     6      NZ      60

-- Resultant DataFrame exported to result.xls excel file
The result.xlsx file was generated, and since we set the following path, it gets saved on the Desktop:
C:\Users\hp\Desktop\result.xlsx
Here is the screenshot of the resultant Excel file:
If you want to prevent pandas from writing the row index (0, 1, 2…) as a separate column in the Excel file, set index=False:
df.to_excel(r'C:\Users\hp\Desktop\result.xlsx', index=False)
If you liked the tutorial, spread the word and share the link and our website, Studyopedia, with others.
For Videos, Join Our YouTube Channel: Join Now
Read More:
 Pandas – Data Cleaning
No Comments