11 Dec Sorting in Tableau
Sorting in Tableau refers to arranging data in a specific order, either alphabetically, numerically, or based on a custom order.
Before moving further, we’ve prepared a video tutorial on how to sort the data in Tableau:
Sorting helps to:
- Organize data: Make it easier to analyze and understand the data.
- Highlight trends: Reveal patterns and trends in the data.
- Improve visualization: Enhance the effectiveness of visualizations, such as bar charts and tables.
Benefits of Sorting in Tableau
- Improved data analysis: Sorting helps to identify patterns and trends in the data.
- Enhanced visualization: Sorting enables the creation of more effective and informative visualizations.
- Increased productivity: Sorting saves time by making it easier to find specific data points or patterns.
Common Use Cases for Sorting in Tableau
- Analyzing customer data: Sorting customer data by demographics, behavior, or preferences.
- Examining sales trends: Sorting sales data by region, product, or period.
- Visualizing survey results: Sorting survey data by question, response, or demographic.
Sort the data in Tableau
We will create a new Tableau Workbook and save it. We have saved it and given it the name Amit_Tableau_Sorting.twb. We connected the data and added the Sample – Superstore.xlsx.
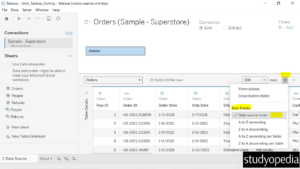
First, drag the Orders table only to the canvas. Now, click the gear button to find the different ways to sort the table Orders.
In Tableau, these options refer to the sort order of a dimension:
- A to Z ascending: Sorts the dimension in alphabetical order from A to Z.
- A to Z descending: Sorts the dimension in reverse alphabetical order from Z to A.
- A to Z ascending per table: Sorts the dimension in alphabetical order from A to Z, but the sort is applied separately to each table or data source.
- A to Z descending per table: Sorts the dimension in reverse alphabetical order from Z to A, but the sort is applied separately to each table or data source.
The following is the screenshot displaying the different forms:
Sort the table in ascending order
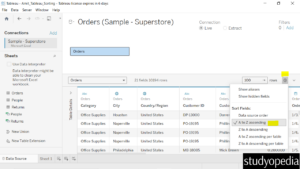
Let us sort the Orders table in ascending order.
Click the gear button and select A to Z ascending to sort the table Orders:
The following is the screenshot:
Sort the table in descending order
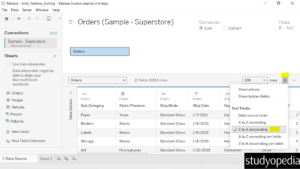
Let us sort the Orders table in descending order.
Click the gear button and select A to Z descending to sort the table Orders:
The following is the screenshot:
Now, click Sheet 1:

Sort the Table Data
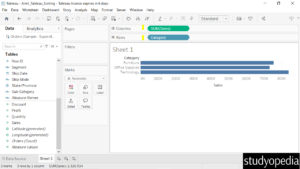
Now, let us sort the Orders table data. First, drag the Category to the Rows shelf, and Sales to the Columns shelf. This will create the following horizontal bar chart:
Click the Category and select Sort:

Now, select do you want to:
Sort By
- Data Source Order
- Alphabetic
- Field
- Manual
Here is the screenshot:

Or, you want to Sort by Order:
- Ascending
- Descending
Here is the screenshot:

Sort by Field
Let us sort by field. Under Sort By, select Field. It will sort based on the Sum of Sales since the Field Name is Sales. Rest, keep the order Ascending, and click the cross symbol:

Now, the bar chart will be sorted in Ascending order:

Sort Manual
Let us sort manually. Under Sort By, select Manual. It will sort manually:

Now, we will change the default and move the Technology category to the center by clicking the arrow buttons:

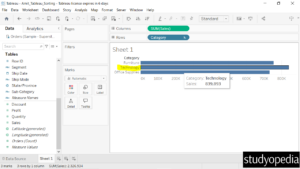
Click the cross sign above, and now the bar chart is manually sorted, and the Technology category is in the center:

The bar chart displays the Technology category in the center:
If you liked the tutorial, spread the word and share the link and our website Studyopedia with others.
For Videos, Join Our YouTube Channel: Join Now
Read More:


No Comments