10 Dec Tableau – Numeric Calculations
Numeric calculations in Tableau perform mathematical operations on numeric fields to create new calculations, metrics, or insights. We will see some examples to understand the concept.
Before moving further, we’ve prepared a video tutorial on Numeric Calculations in Tableau:
Types of Numeric Calculations
The following are some common types of numeric calculations. Consider fields as Field A, Field B, etc.
Arithmetic Calculations
- Addition: Field A + Field B
- Subtraction: Field A – Field B
- Multiplication: Field A * Field B
- Division: Field A / Field B
- Modulus: Field A % Field B (remainder of division)
- Exponentiation: Field A ^ Field B (raise to power)
Comparison Calculations
- Equal: Field A = Field B
- Not Equal: Field A ≠ Field B
- Greater Than: Field A > Field B
- Less Than: Field A < Field B
- Greater Than or Equal: Field A ≥ Field B
- Less Than or Equal: Field A ≤ Field B
Logical Calculations
- AND: Field A AND Field B (both conditions true)
- OR: Field A OR Field B (either condition true)
- NOT: NOT Field A (reverse condition)
Aggregate Calculations
- SUM: SUM(Field A)
- AVERAGE: AVG(Field A)
- MAX: MAX(Field A)
- MIN: MIN(Field A)
- MEDIAN: MEDIAN(Field A)
- COUNT: COUNT(Field A)
Advanced Calculations
- RANK: RANK(Field A)
- PERCENTILE: PERCENTILE(Field A, 0.5) (50th percentile)
- STDEV: STDEV(Field A) (standard deviation)
- VARIANCE: VARIANCE(Field A)
- CORREL: CORREL(Field A, Field B) (correlation coefficient)
Example – Numeric Calculations in Tableau
Let us see an example of numerical calculations. Open Tableau and let us create a new Tableau workbook.
Go to File and click New:

After opening a new file, go to File and click Save As:

Save the file as Amit_Tableau_Calculations.twb:

We saved our new workbook successfully above. Now, click Connect to Data to upload the data source:

Click Microsoft Excel and select the sample xls file we selected in the previous lessons, i.e., Sample – Superstore.xls. Select the .xls file and click Open:

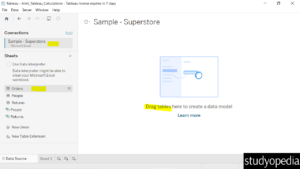
All the tables (excel workbook sheets) are now visible on the left. Drag the Orders sheet to the canvas:
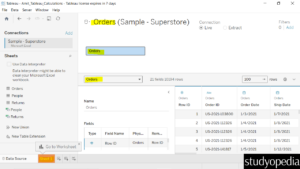
The Orders table (sheet) is now visible with the rows and columns.
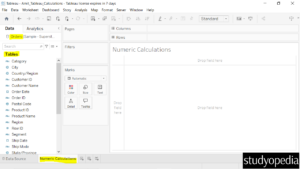
Click the Sheet 1 below to reach the Worksheet so that we can begin with the calculations:
We have renamed the Sheet 1 to Numeric Calculations. Also, the fields of the Orders table are visible on the left:
Create Aggregate Calculations
Let us create a calculated field using the aggregate function. We will create minimum sales values for different ship modes.
Go to the Analysis menu and click on it. After that, click Create Calculated Field:

Click on the arrow to display all the built-in functions. From the dropdown, click Number to display only the numerical functions:
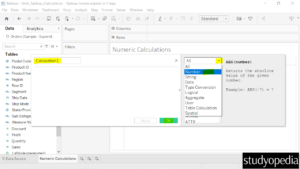
Set the name of the calculation. We will set it to Minimum_Sales_ShipMode to create minimum sales values for different ship modes.
From the right, select the MIN() function. After selecting, on the left, set the formulae for minimum sales i.e. MIN([Sales]) :
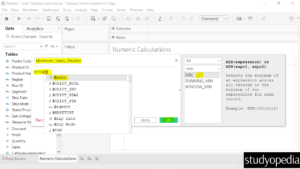
Now, the formulae can be seen and there are no error messages. Click OK:
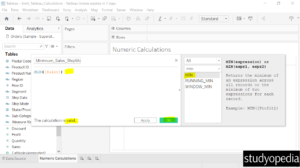
On the left, the new calculation field is visible i.e., Minimum_Sales_ShipMode:
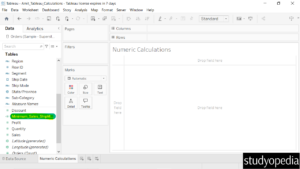
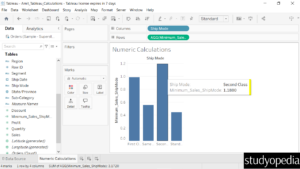
Drag the Ship Mode to the Columns shelf, and the new Minimum_Sales_ShipMode to the Columns shelf.
On the Rows shelf, the AGG is visible. Here, AGG means Aggregate.
After dragging, the bar chart will be visible as shown below:
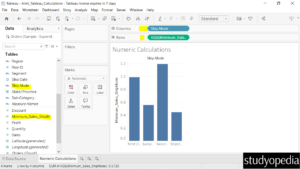
Keep the mouse cursor to display the ship mode and minimum sales for a specific mode:
If you liked the tutorial, spread the word and share the link and our website Studyopedia with others.
For Videos, Join Our YouTube Channel: Join Now
Read More:


No Comments