11 Dec Create a Forecast in Tableau
In this lesson, learn to create forecasting in Tableau. We will forecast the value of the measure Profit for the next 3 years.
Before moving further, we’ve prepared a video tutorial on creating forecasting in Tableau:
Let us first understand what forecasting is and what are the best practices.
What is Forecasting in Tableau
Forecasting in Tableau is a predictive analytics feature that allows users to predict future trends and patterns in their data. It uses a combination of statistical models and machine learning algorithms to generate forecasts based on historical data.
Features of Forecasting in Tableau
- Automatic Model Selection: Tableau automatically selects the best forecasting model based on the data.
- Confidence Intervals: Tableau provides confidence intervals to indicate the uncertainty associated with the forecast.
- Forecasting for Multiple Time Series: Tableau allows users to forecast multiple time series at once.
Steps to Create a Forecast in Tableau
- Drag a Date Field to the Columns Shelf: This will create a time series view.
- Drag a Measure to the Rows Shelf: This will create a line chart or area chart.
- Click on the “Analytics” Pane: This will open the analytics pane.
- Click on “Forecast”: This will create a forecast for the selected time series.
- Adjust the Forecast Settings: Users can adjust the forecast settings, such as the forecast period and the confidence interval.
Best Practices for Forecasting in Tableau
- Use a sufficient amount of historical data: A minimum of 2-3 years of historical data is recommended.
- Choose the right forecasting model: Tableau automatically selects the best forecasting model, but users can also choose from other models, such as ARIMA or exponential smoothing.
- Monitor and adjust the forecast: Forecasts should be monitored and adjusted regularly to ensure accuracy.
Example to create a Forecast in Tableau
Let us forecast the value of the measure Profit for next years. We have created a new Tableau workbook Amit_Tableau_Forecasting.twb, and used the same Sample – Superstore.xls.
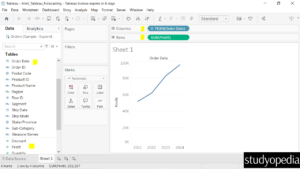
Drag the Dimension Order Date to the Columns and Measure Sum to the Rows. This creates a Line Chart:
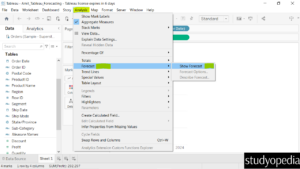
Go to the Analysis menu and click Forecast:
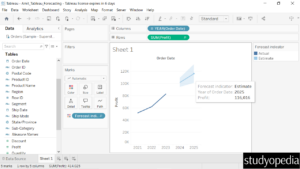
Now, the forecast is visible with the indicator:
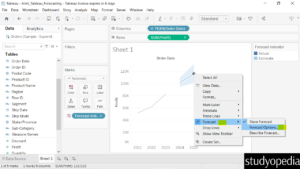
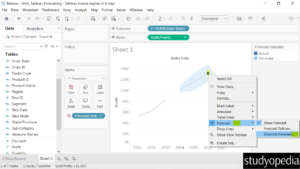
Right-click the forecast line chart, and click Forecast, and then Forecast Options:
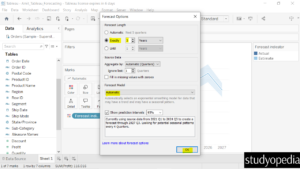
Now, under the Forecast Options, set the Forecast Length, Model, etc.
The default is the following:
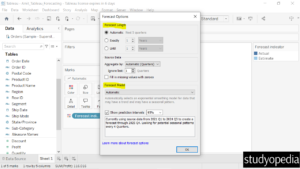
We will set the Forecast Length to Exactly 3 years using the option button. Click OK:
Describe Forecast
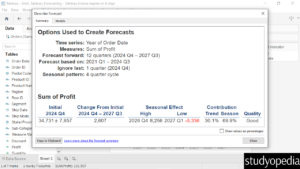
Let us get each detail of our Forecast. Right-click the predicted line chart. Click Forecast, and then Describe Forecast:
The forecast details are here:
If you liked the tutorial, spread the word and share the link and our website Studyopedia with others.
For Videos, Join Our YouTube Channel: Join Now
Read More:


No Comments