06 Sep Power BI – Update the cards based on records
We created a card in Power BI in the previous lessons. Now, let us update according to the columns. Create any chart and update the card values based on the chart accordingly.
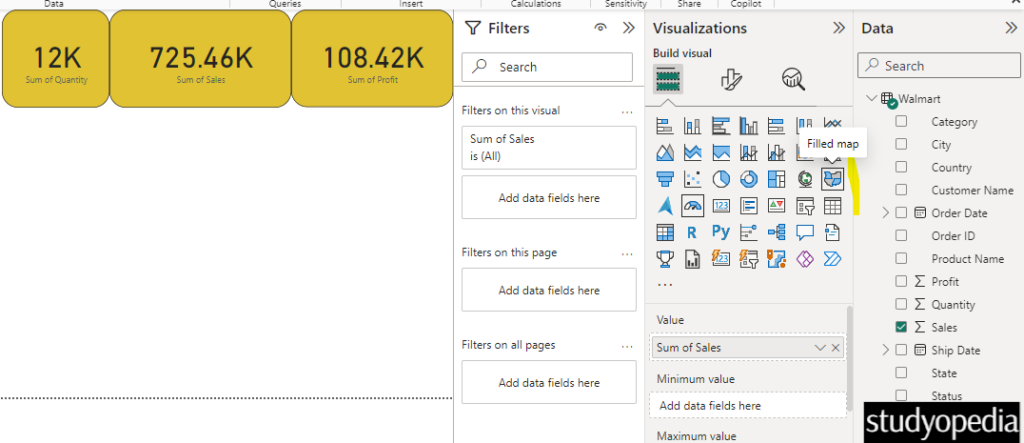
Let us create a map. Click on the Map under the Visualizations pane:

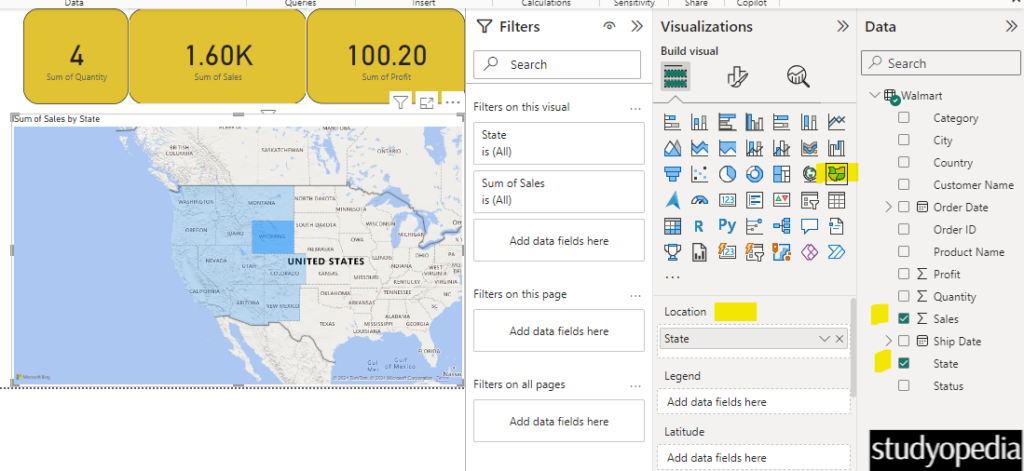
After clicking the Filled Map visual, I have selected the Sales and State columns. The State column is now visible under Location and the map was created successfully. I clicked the Wyoming state below:

On keeping the mouse cursor on any location i.e. the State of US related to our data set, the tooltip will display the specific information. As shown above, when you click on any of the states, the card is also updated accordingly.
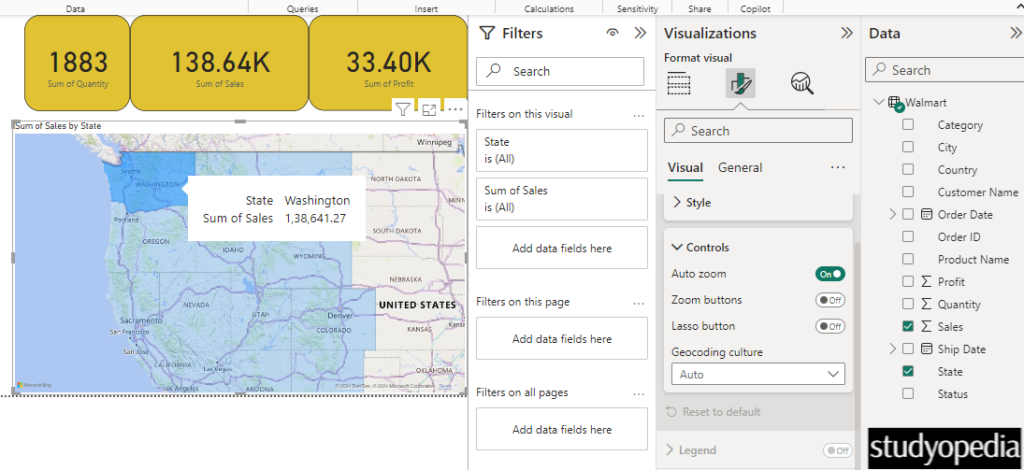
I clicked the Washington in the map below and the card updated with the sum of Quantity, the Sum of Sales, and the Sum of Profits. Now, the cards are displaying the Washington sales data. The mouse cursor displays a tooltip displaying the same state Washington and Sum of Sales of the same state:

We updated the card values. You can do this with any chart.
Video Tutorial
If you don’t want to follow written instructions, you can check out our video tutorial on how to update the cards based on your data in Power BI:
If you liked the tutorial, spread the word and share the link and our website Studyopedia with others.
For Videos, Join Our YouTube Channel: Join Now
Read More:


No Comments