
06 Sep Power BI – Table Conditional Formatting
In this lesson, we will understand what is conditional formatting in a Power BI Table. With conditional formatting, easily:
- Format specific columns
- Set data bars
- Different Font and background color for each column
- Set icons for records
Now, in this lesson, we will learn how to:
- Set a color on a Table column with Conditional Formatting in Power BI
- Set an icon on a Table column with Conditional Formatting in Power BI
We have created a page and given it the name “Conditional Formatting”.
Set a color on a Table Column with Conditional Formatting
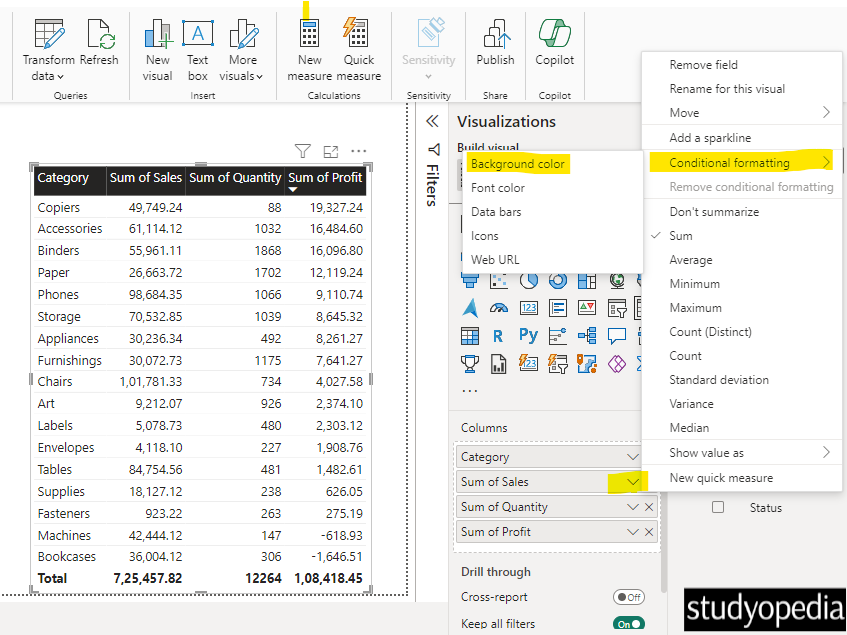
We will set a color for the table column with Conditional formatting in Power BI. Let’s say we will format the column Sum of Sales. Under the Columns, click the Sum of Sales arrow. Select Conditional Formatting. Now, some options are visible:
- Background color
- Font color
- Data bars
- Icons
- Web URL
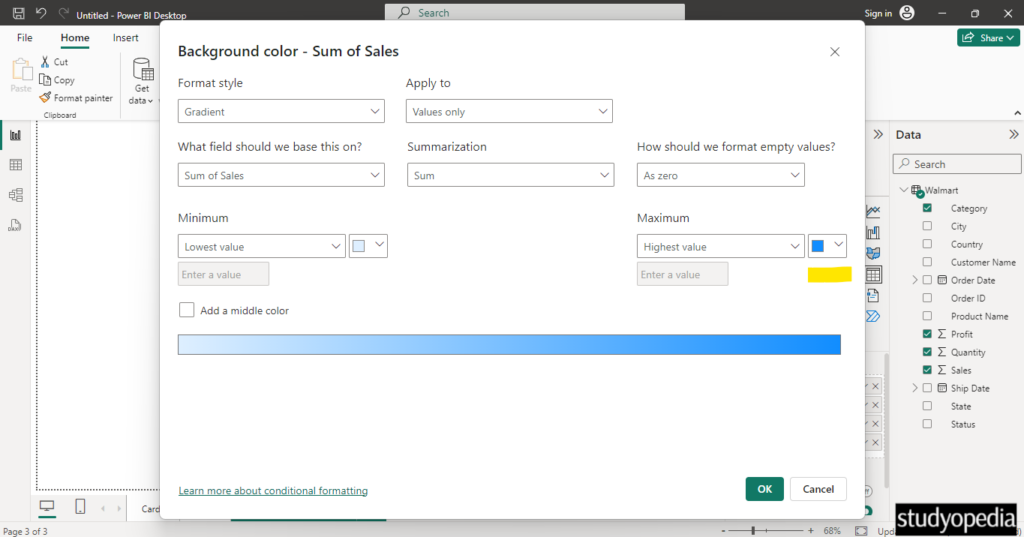
Click Background color to set a background color for the column values:
Set the color for the Maximum value i.e. for the maximum sales:
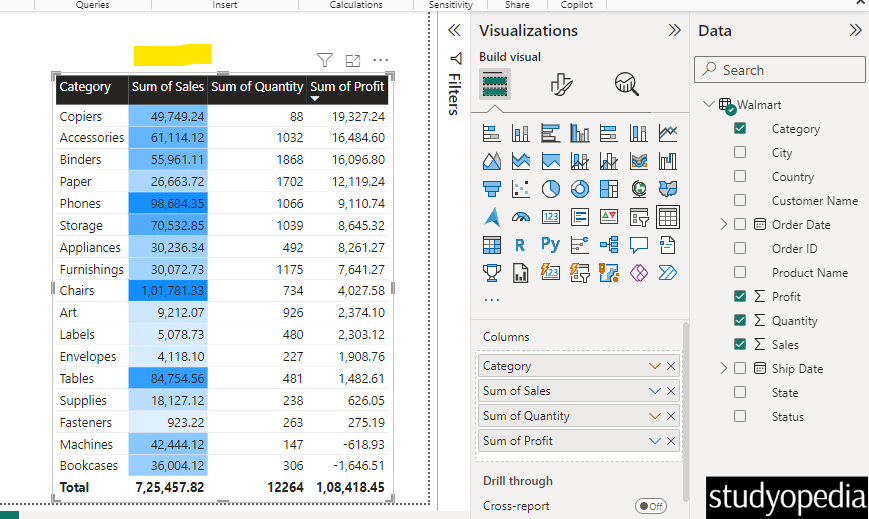
Now, you can see the same color implemented for the Sum of Sales column. The darkest color means the highest value whereas the lightest one represents the lowest value. Here is the screenshot:
Sort the column by clicking on the column arrow to understand the difference. Let me sort in descending order i.e., the category with the maximum sales will be at the top place:
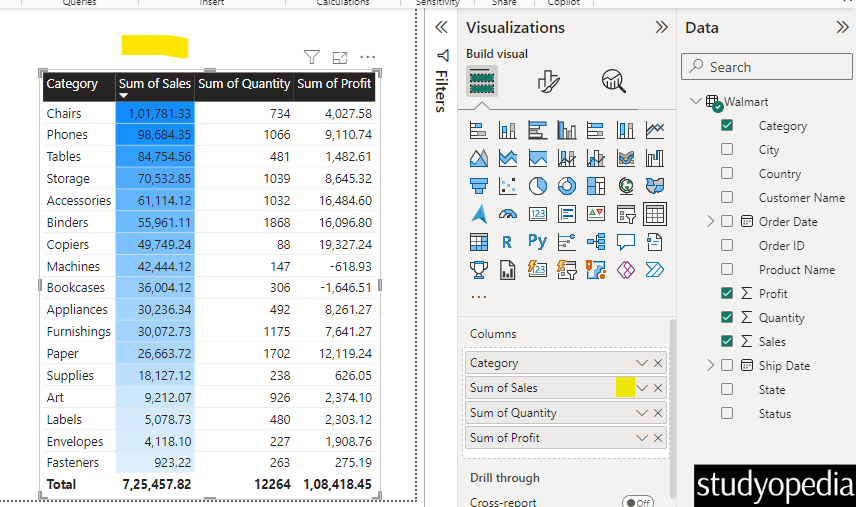
We sorted the above, and the maximum amount has the darkest color.
Set an icon on a Table Column with Conditional Formatting
We can also set an icon on a table column. Let’s say we will format the column Sum of Profit. Under the Columns, click the Sum of Profit arrow. Select Conditional Formatting. Now, some options are visible:
- Background color
- Font color
- Data bars
- Icons
- Web URL
Click Icons to set an icon for the column values:
![]()
Set the icon here. We will set it to an arrow icon so that it’s easy to read and understand. Also, you can check the rules. The alignment of the icon can also be set:
![]()
We have set the style i.e. the arrow icons here and the rules are also updated. Click OK:
![]()
After clicking OK, the icons are implemented for the Sum of Profits column. The up arrow means the highest value whereas the down arrow represents the lowest value. Here is the screenshot:
![]()
Sort the column Sum of Profits by clicking on the column arrow to understand the difference. Let me sort in ascending order i.e., the category with the maximum sales will be at the top place. Now, the category with the minimum sum of profits would be at the bottom:
![]()
Video Tutorial
If you don’t want to follow written instructions, you can check out our video tutorial on how to apply conditional formatting for a table in Power BI:
If you liked the tutorial, spread the word and share the link and our website Studyopedia with others.
For Videos, Join Our YouTube Channel: Join Now
Read More:
No Comments