10 Sep Power BI – Group rows
Group the values from multiple rows in a single value with the Power Query Editor in Power BI. In this lesson, we will get the count by grouping from raw data.
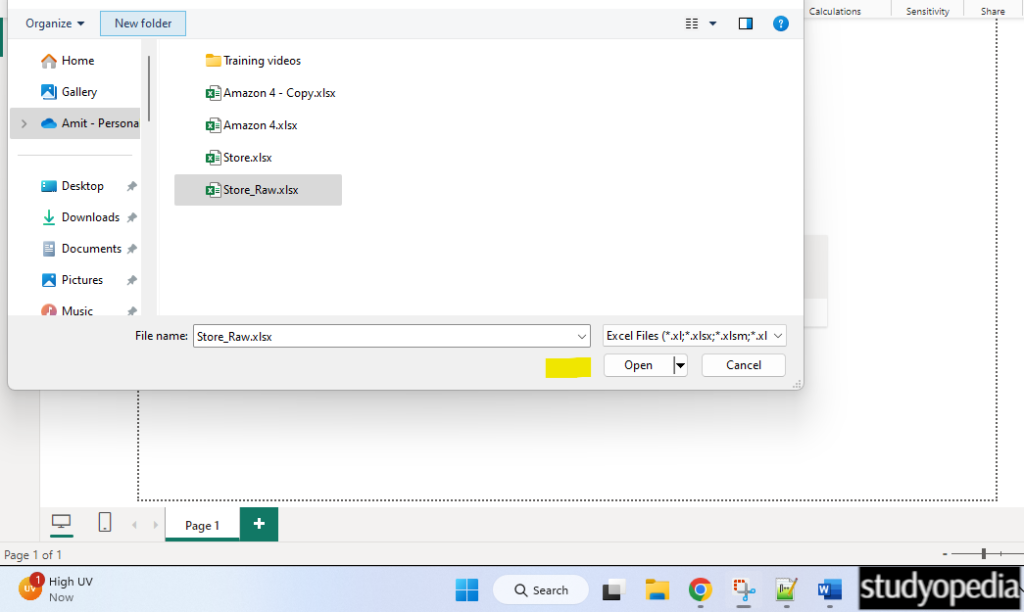
Input File: Store_raw.xlsx
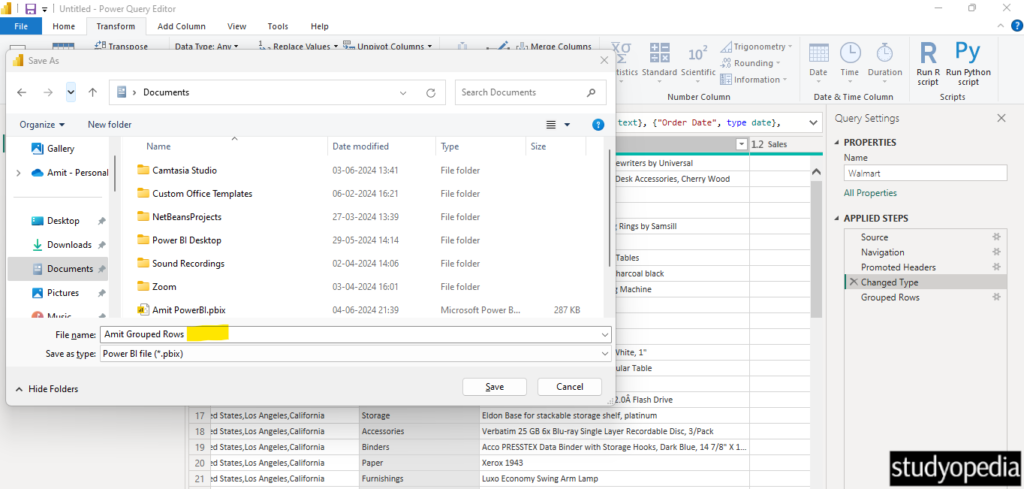
Output Saved as: Amit Grouped Rows.pbix
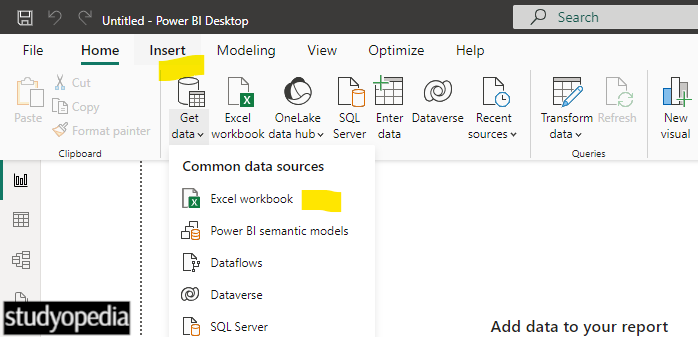
Click Get data and then Excel Workbook:
Open your Excel file in Power BI:
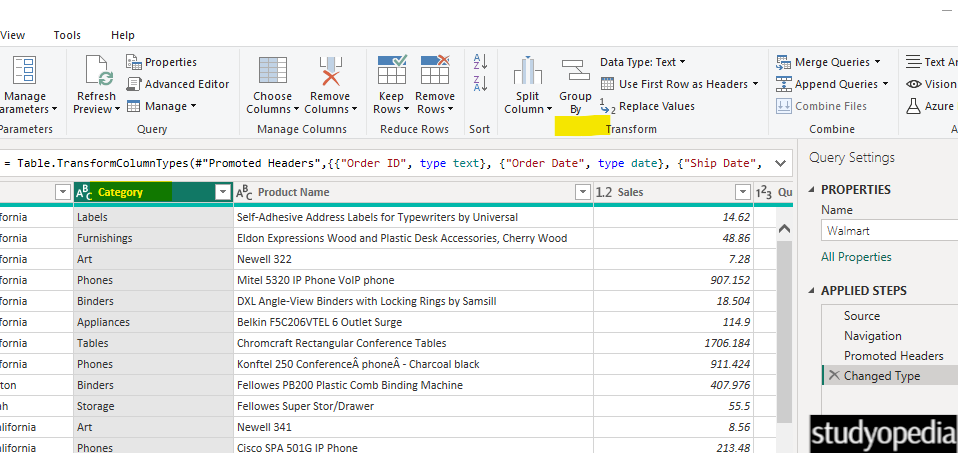
Now, select the workbook and click Transform Data to open the Power Query Editor directly:
![]()
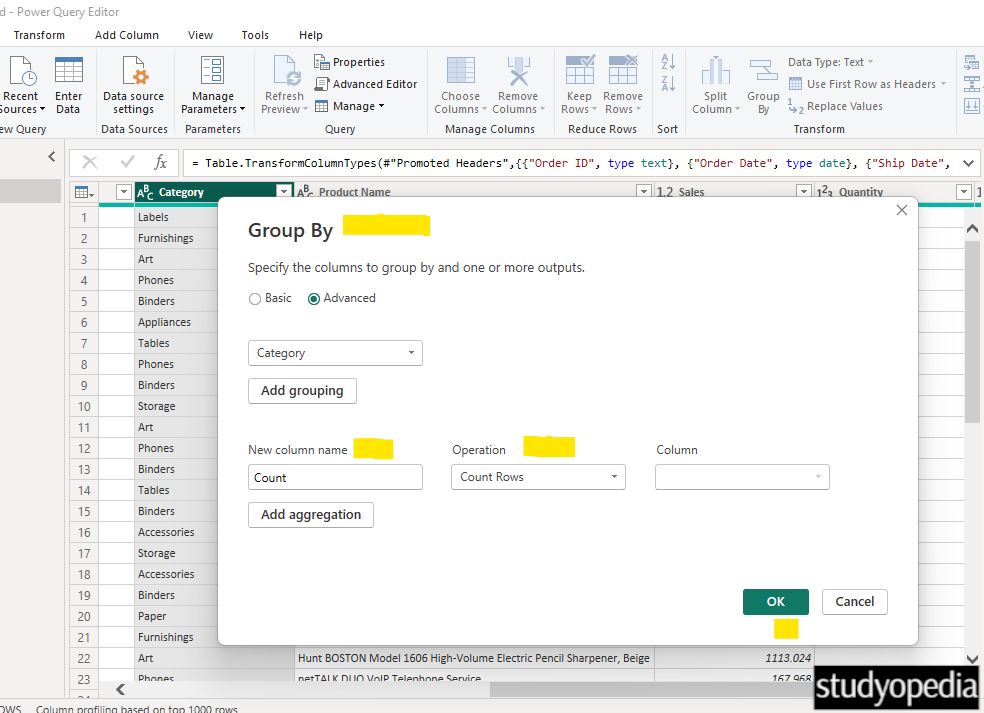
Select the Category column and click Group By. This calculates the number of orders for each category:
The dialog box for Group By will open. Check the details here. Here, you can add more groupings but we will keep the default.
You can also add a new column name. The default name for the new column i.e. the resultant column is Count. The operation is by default Count Rows. You can also change it to Sum, Average, Median, or Count Distinct Rows. We will keep the default:
Click On and the result is now returned. The new column name is Count:
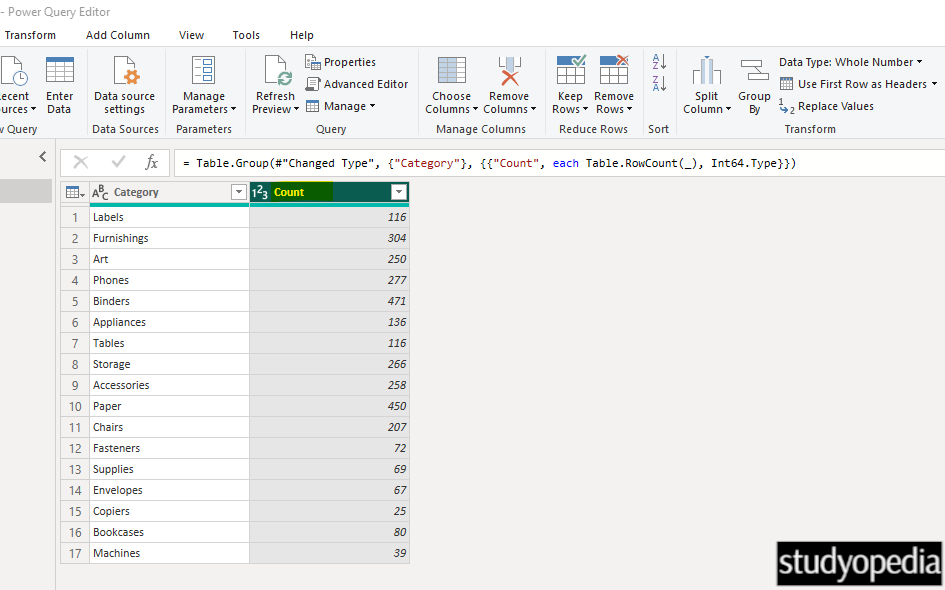
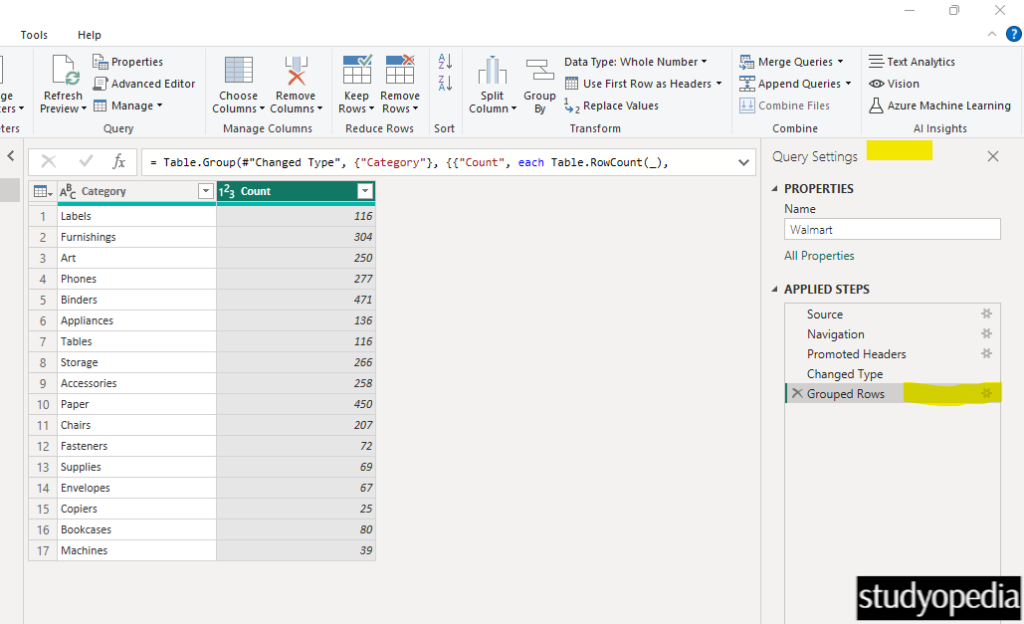
Now, we have the count of rows i.e. orders based on each category. On the right, in the Query Settings section, the changes are visible i.e. Grouped Rows under the APPLIED STEPS.
I am saving it as Amit Grouped Rows:
Video Tutorial
If you don’t want to follow written instructions, you can check out our video tutorial on how to group rows in Power BI:
If you liked the tutorial, spread the word and share the link and our website Studyopedia with others.
For Videos, Join Our YouTube Channel: Join Now
Read More:
No Comments