
10 Sep Power BI – DAX Calculated Columns
Add a new column to your table using the concept of calculating columns. Calculated columns calculate results by using DAX. Let us load an Excel file Region.xlsx:
Input File: Region.xlsx
Ouptut Saved as: AMIT DAX Calculate Columns.pbix
Click Get data and then Excel Workbook or directly click Excel Workbook. Select your Excel file Region.xlsx and click Open:
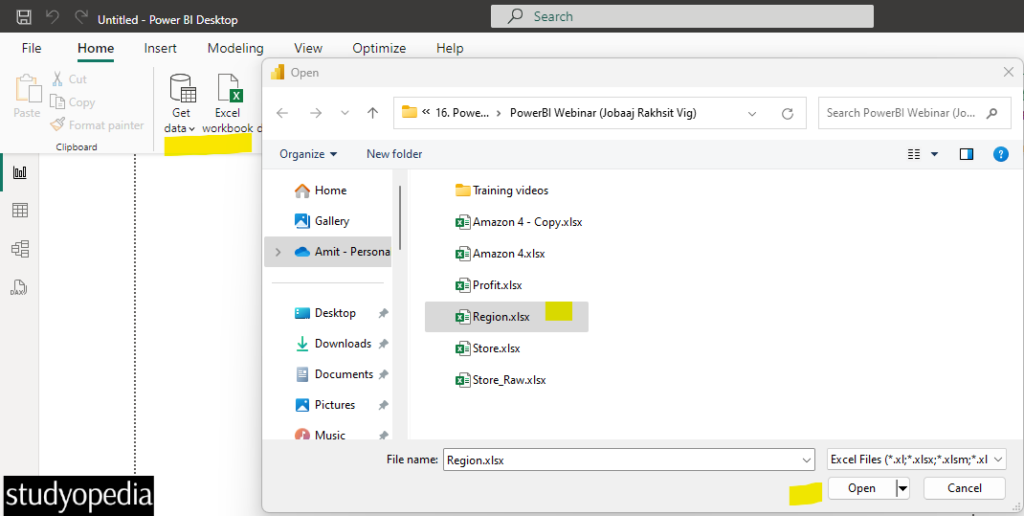
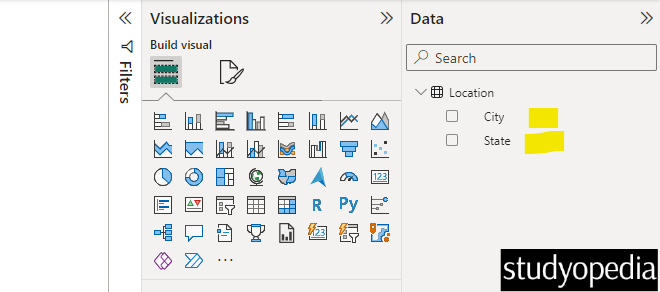
We have our Region.xlsx now. Load it now. After loading the following two columns are visible in the Location table:
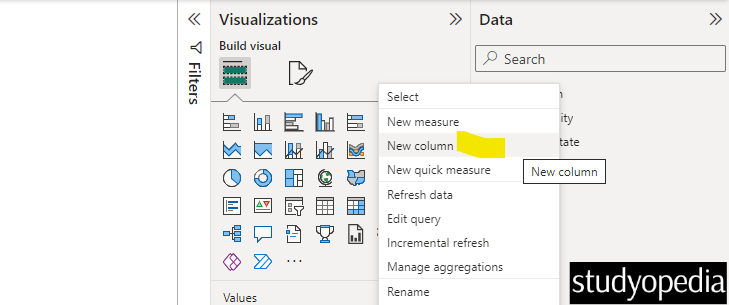
To add a new column, right-click on the table and click New column. Calculate columns are created and displayed in Report View, Data View, or Model View by using this New column feature:
Now, the formulae bar is visible. Add the DAX expression to set both the city and state together:
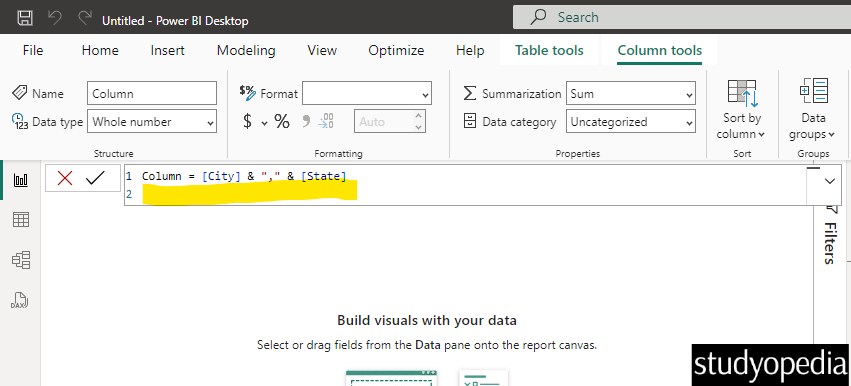
We created a new column and a symbol is also visible:
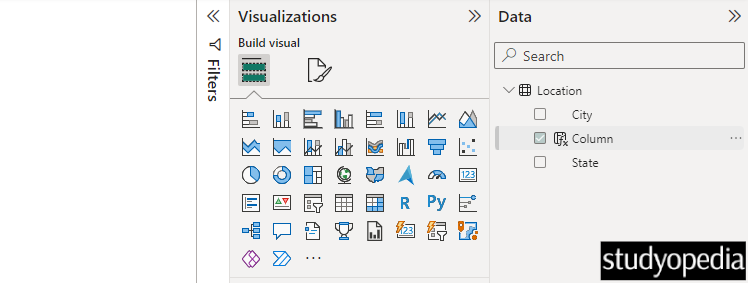
Above the Column text in the formulae can be replaced with whatever name you want for the new column. We can also rename it later as shown below. Right-click the new column and click Rename:
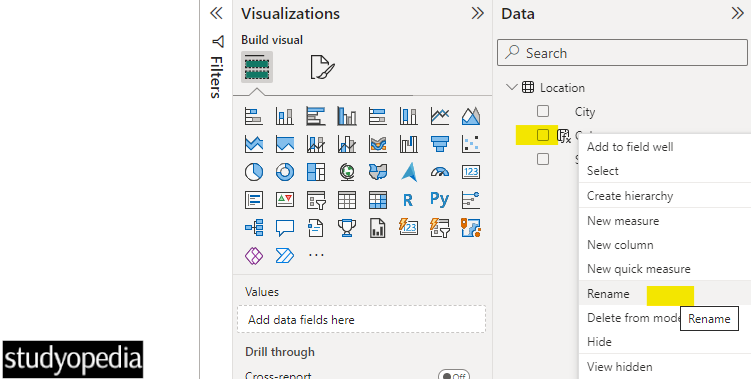
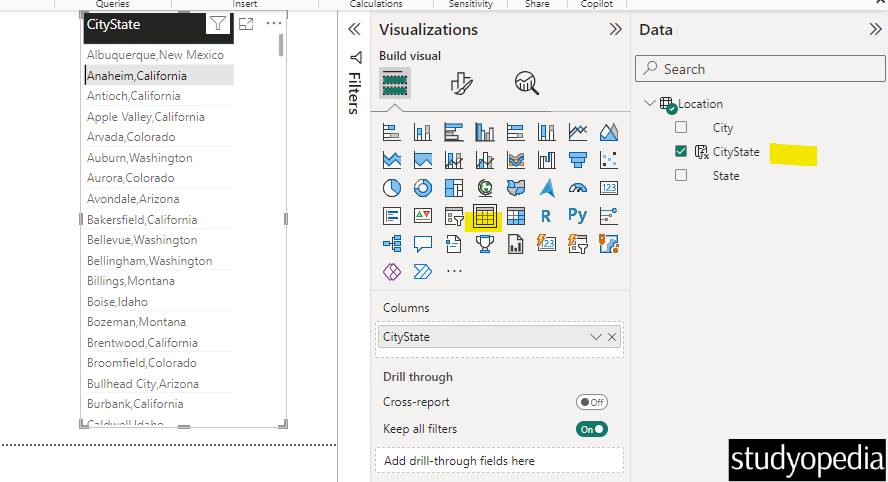
We renamed it successfully. For example, we renamed it CityState. You can give any name.
We selected the column and clicked the Table under the Visualizations pane. Now, our column is visible with the City as well as State names:
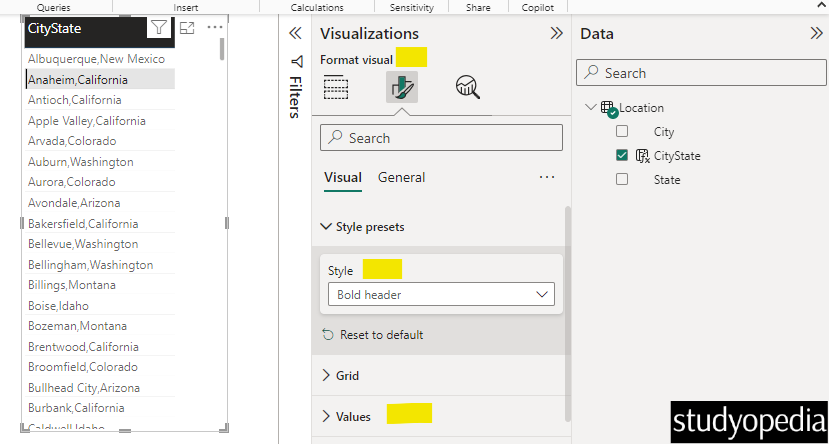
Note: We also formatted the above table using the Format your visual under the Visualizations pane. For the bold header, we selected the style. To increase the font size, we clicked the Values as shown below:
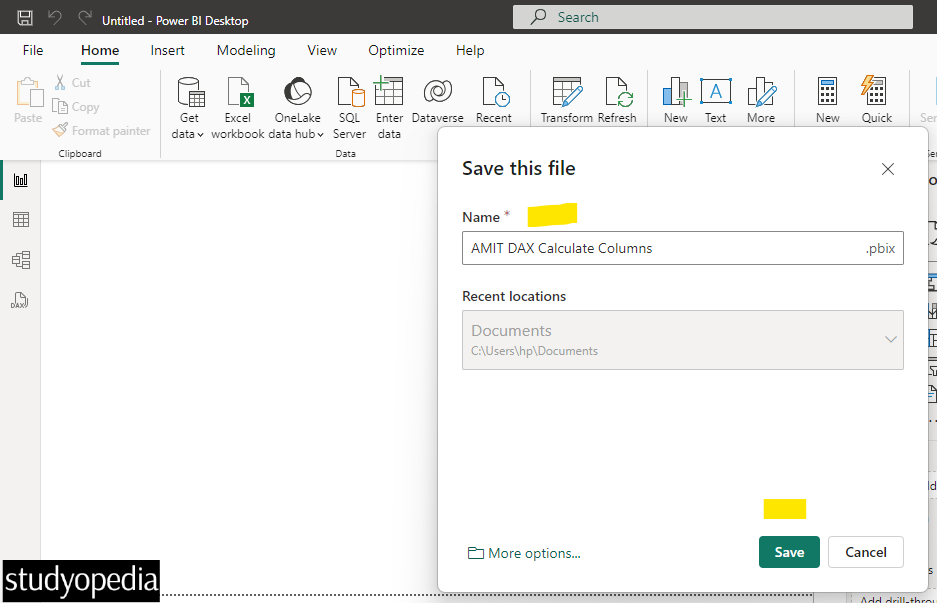
Press CTRL+S and save it:
Video Tutorial
If you don’t want to follow written instructions, you can check out our video tutorial on how to create DAX Calculated Columns in Power BI:
If you liked the tutorial, spread the word and share the link and our website Studyopedia with others.
For Videos, Join Our YouTube Channel: Join Now
Read More:


No Comments