
06 Sep Power BI – Create a Table
Display data in a tabular format easily with Power BI. In this lesson, we will create a table and display records. With that, we also perform some operations:
- Create a Table
- Sort the Table values
- Remove a column from the table
Create a Table in Power BI
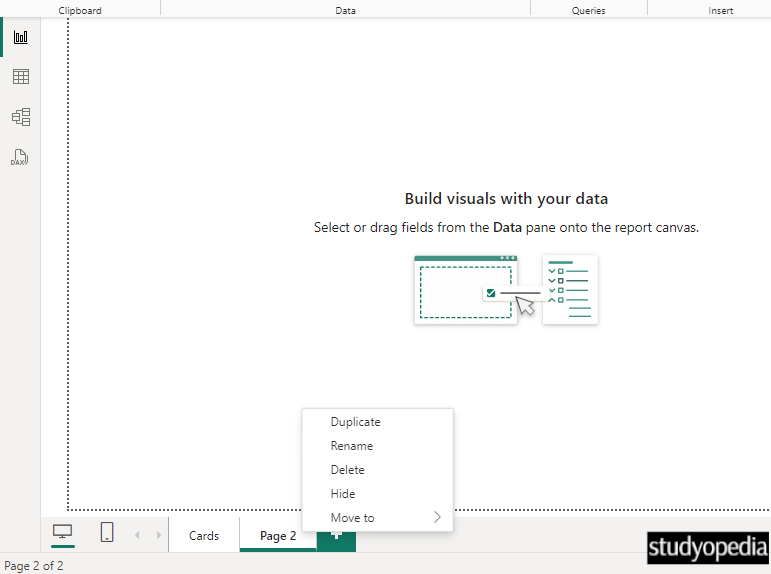
Let us first create a table. Open Power BI and load your data. We loaded an Excel file in Power BI. After loading, set a new page and renamed it to Table:
Under the Visualizations pane, click Tables to create a table:
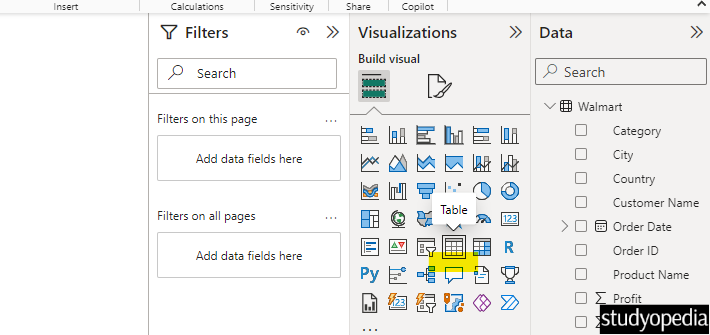
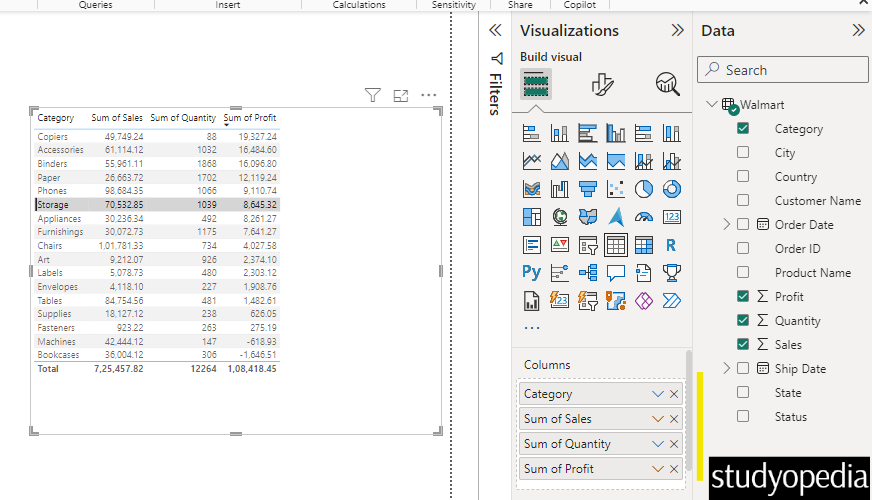
Now the table is visible. On the right, the loaded data columns are visible under Data. We will add the same data to the table, but only some selected columns.
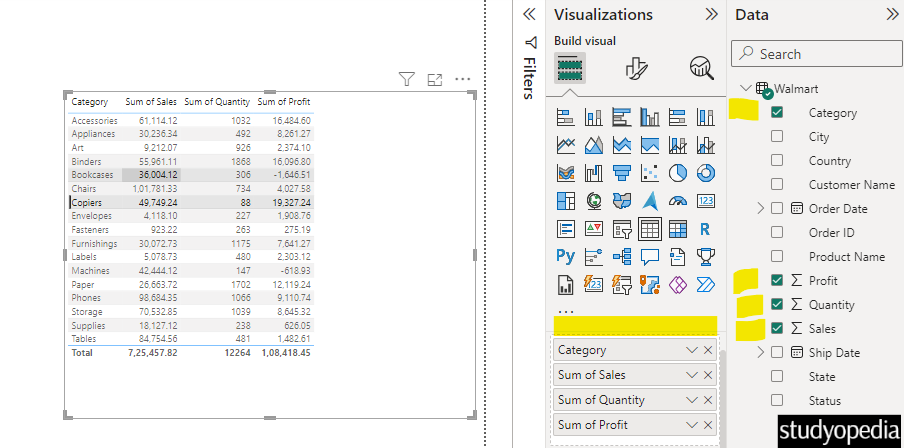
Drag and drop each field to the Values you want the table to have. We selected the following values for the table:
- Category
- Sum of Proft
- Sum of Quantity
- Sum of Sales
It would be visible in the table in the order of selection. Here is the screenshot:
Sort the table values in Power BI
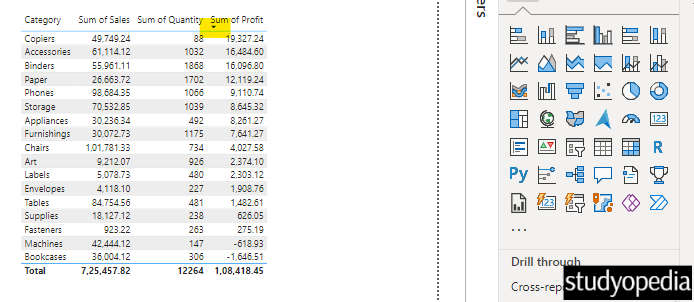
To sort the table, select the arrow key as shown below. Here, we sorted the table according to the Sum of Profit column values. Keep on clicking to sort in ascending or descending order:
Remove a column from the table in Power BI
To remove a column, click the cross sign as shown below. This will remove that specific column from the table on the left:
Video Tutorial
If you don’t want to follow written instructions, you can check out our video tutorial on how to create a table in Power BI:
If you liked the tutorial, spread the word and share the link and our website Studyopedia with others.
For Videos, Join Our YouTube Channel: Join Now
Read More:
No Comments