06 Sep Power BI – Create a slicer
In this lesson, we will learn what is a slicer in Power BI. With that, we will also create a slicer for the first time in Power BI Desktop.
What is a Slicer in Power BI
Slicers are Interactive Filters. Consider it an interactive visual filter to narrow down the data displayed in reports. Filter your charts, maps, reports, tables, etc. easily with Slicer. Slicers are another way of filtering.
The following are the types of Slicers in Power BI
- Numeric range slicers
- Relative date slicers
- Relative time slicers
- Resizable slicers
- Hierarchy slicers with multiple fields
Create a Slicer in Power BI
To create a slicer, go to the Visualizations pane, and click the Slicer:
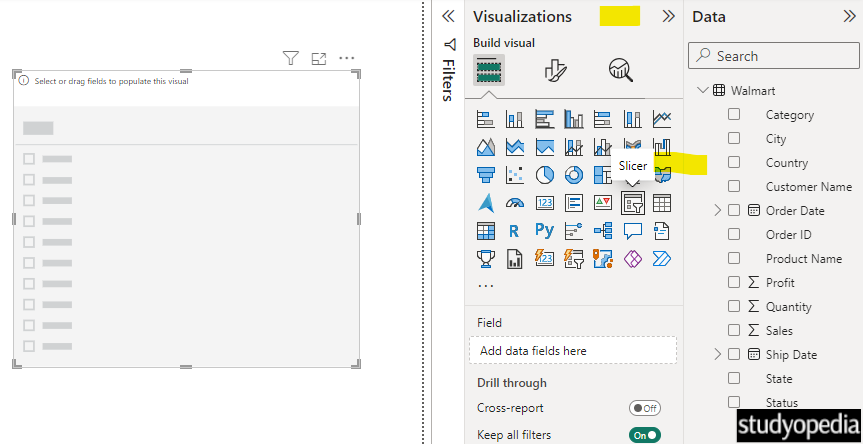
As you can see, there is no data in the slice, therefore, we will add a column.
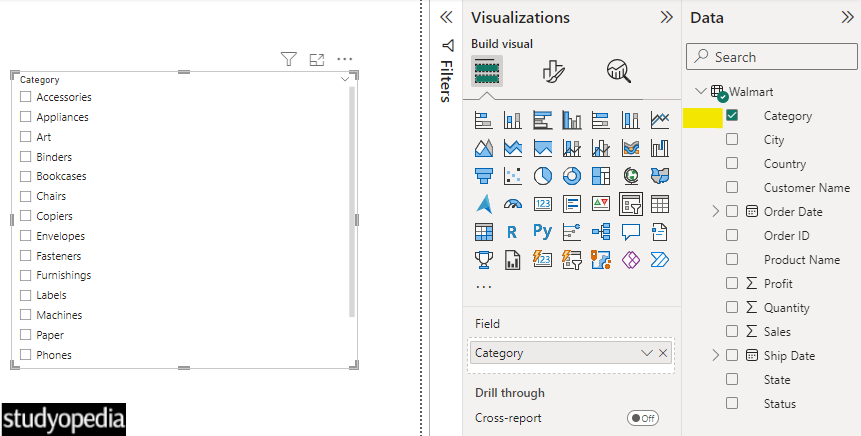
I have selected the Category column from our data. Now, the slicer will display the same with a checkbox beside each category name:
Now, let us create a table on the same canvas. We will control the table content using the slicer.
Go to the Visualizations pane, and click Tables. We create a table:
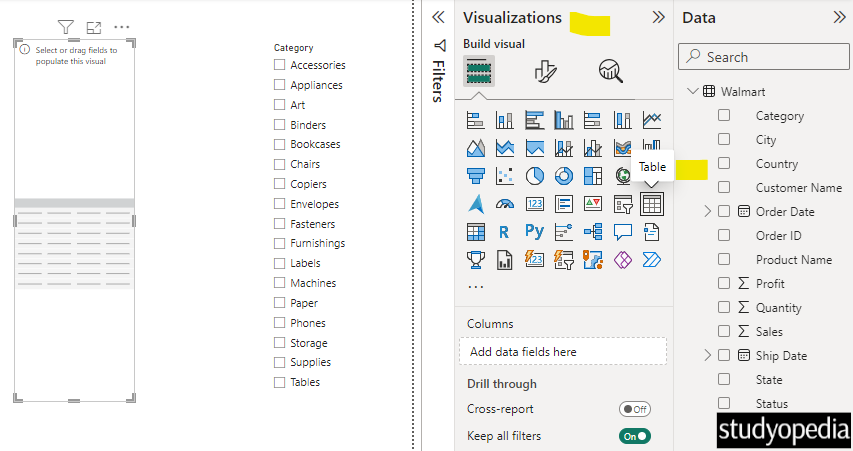
As you can see above, the table is empty. Select the table and click on any column to populate the table. We will click the Profit and Category. Now the table is also visible:
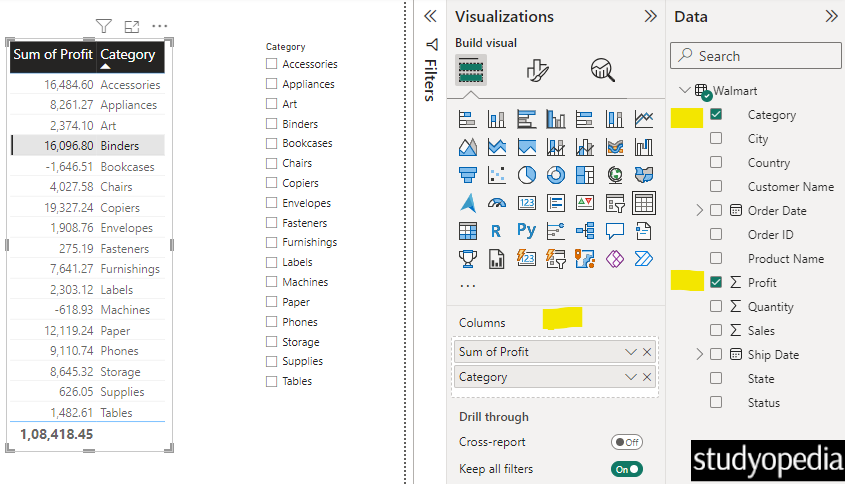
Let us add some more columns to the slicer. I will add the state also. This will add a dropdown to each category in the slicer. Select the slicer and click the State column from the Data on the right:
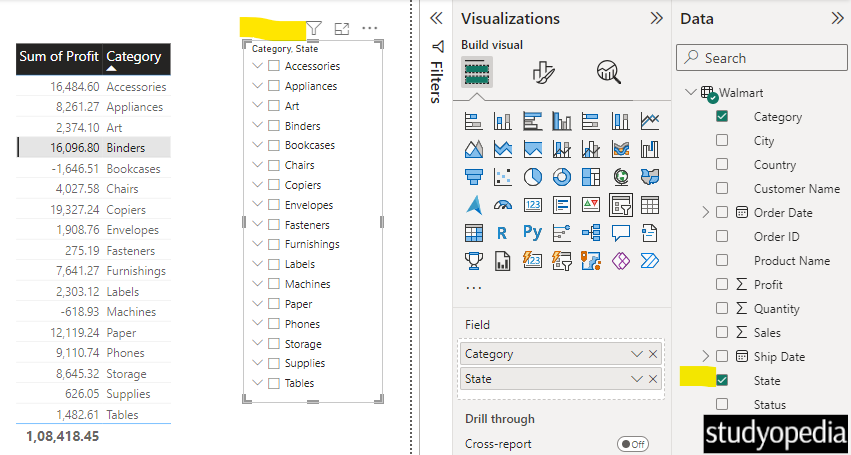
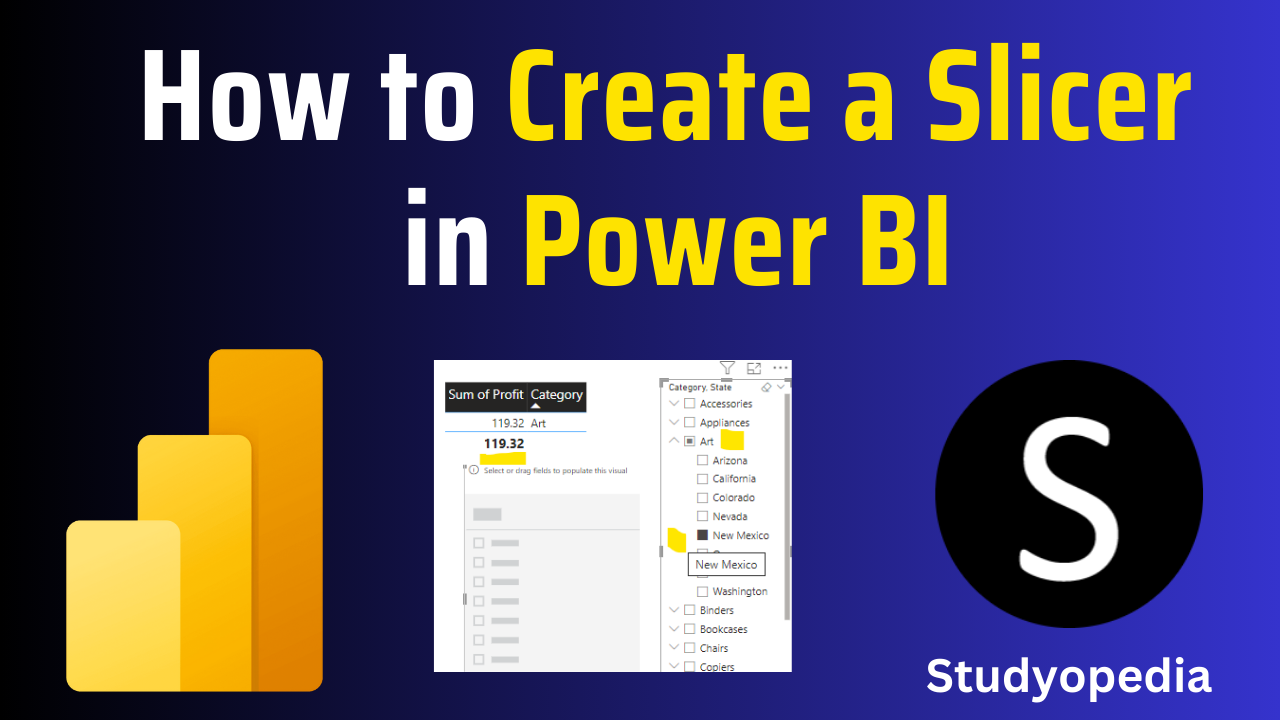
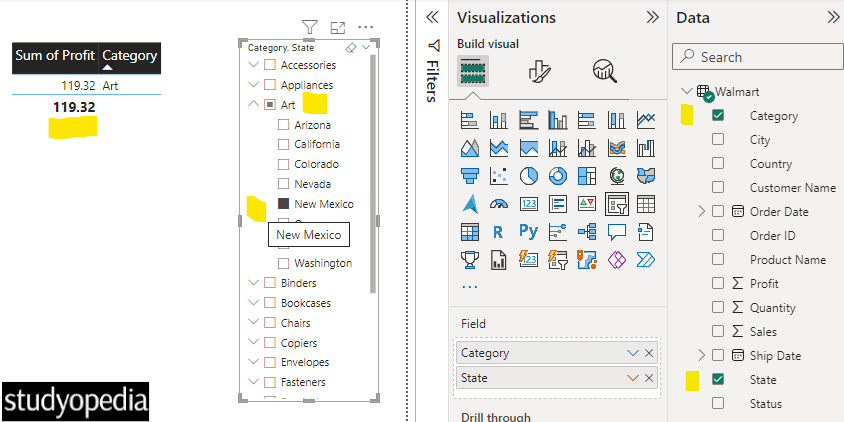
What we did above, we added a dropdown to each slicer. This displays the states dropdown since we select the State column. Click on the dropdown and let’s say we want to check the profits for the Arts category in the state of New Mexico:
Video Tutorial
If you don’t want to follow written instructions, you can check out our video tutorial on how to create a slicer in Power BI:
If you liked the tutorial, spread the word and share the link and our website Studyopedia with others.
For Videos, Join Our YouTube Channel: Join Now
Read More:


No Comments