
06 Sep Power BI – Create a Filter
In this lesson, we will learn what is a filter, its types, and how we can set a filter in Power BI with examples. Filter narrows down the data to be displayed.
What is a Filter in Power BI
A filter in Power BI narrows down the data displayed in your reports and visualizations. It is based on specific criteria, such as a filter for showing data only for a specific region, such as “North India”. The main purpose of filters is to ease in analyzing and drawing insights.
Types of Filters in Power BI
The following are the types of Filters:
- Filters on this page
- Filters on all pages
- Filters on this visual
Create a Filter
Under your PowerBI version, two filters are visible i.e., Filters on this page, and Filters on all pages as shown below:
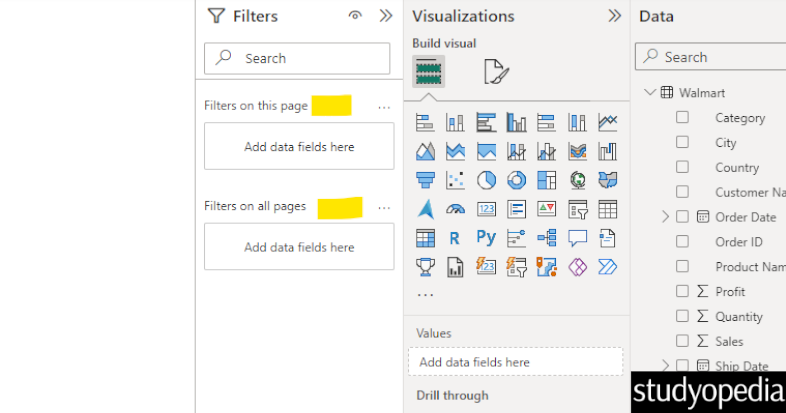
More filter options are visible. Let us create a chart and enable filters on it.
We will create a Pie Chart based on Sales and State columns. Now, the Filters on this visual section are also visible. Under that, our two columns for the filter are also visible i.e., State and Sum of Sales:
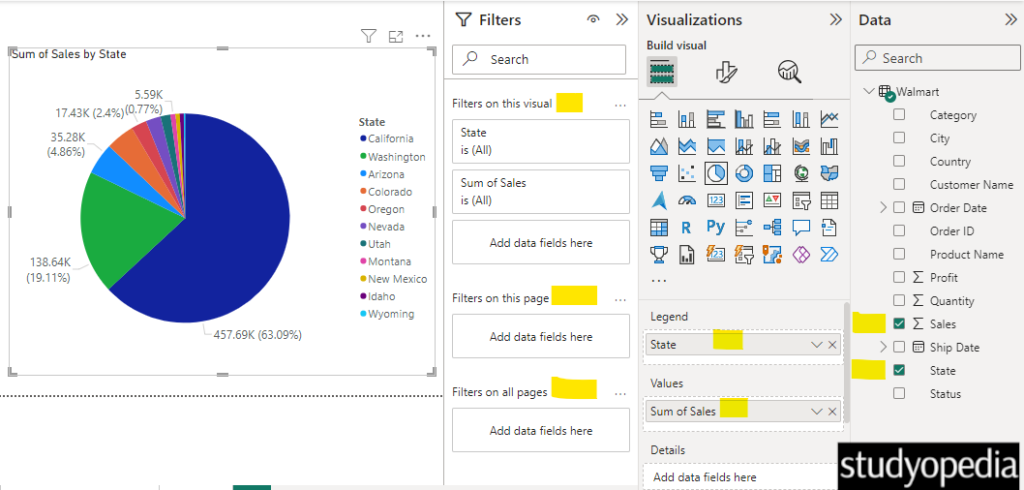
Now, how do you get the data for a specific category? Just filter.
Drag the Category column to the Add data filed here section. Now, the Filters on this visual section will have the 3d column as well i.e. the Category column which we just dragged and dropped:
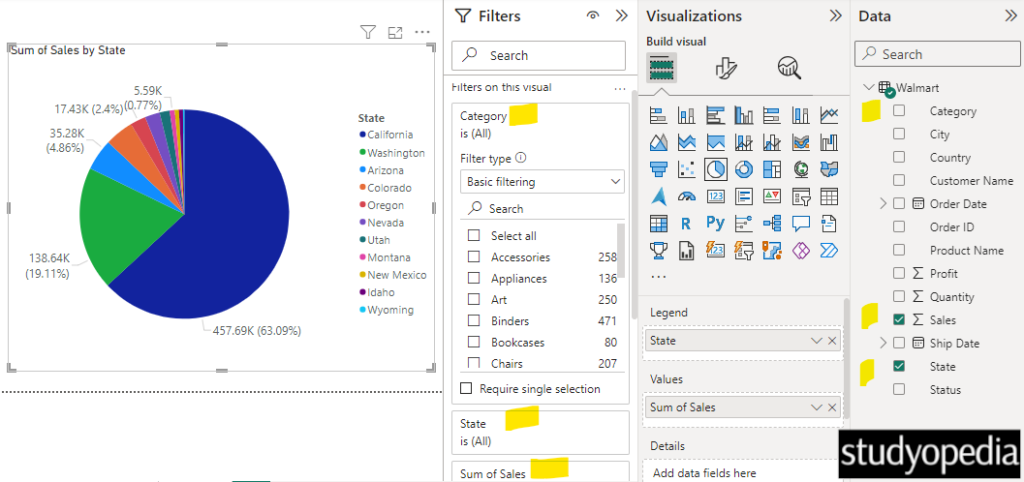
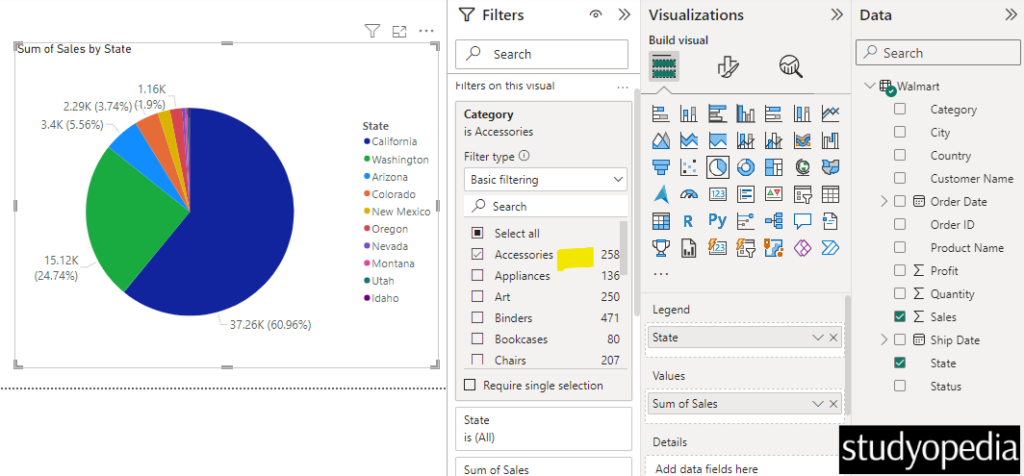
Now, select the specific category and that is it. The results will be filtered and visible on the pie chart. I have chosen the Accessories category and the Pie Chart has also been updated accordingly:
Video Tutorial
If you don’t want to follow written instructions, you can check out our video tutorial on how to create filters in Power BI:
If you liked the tutorial, spread the word and share the link and our website Studyopedia with others.
For Videos, Join Our YouTube Channel: Join Now
Read More:


No Comments