
06 Sep Power BI – Create a card
Cards in Power BI are indicators giving the values. It displays only a single value, like total sales, market share, etc. It shows a quick snapshot of key data points on a dashboard.
The card can be formatted to update the text size, color, and background to match the design of your report. Cards can be made to allow users to click on them and get more information.
Create a card in Power BI
Let us see how to create a card on the canvas. We saw above how to upload the excel data and load it in Power BI. Continuing from there, now select the sum of Profit from the Data and it will create a clustered column chart by default as shown below:
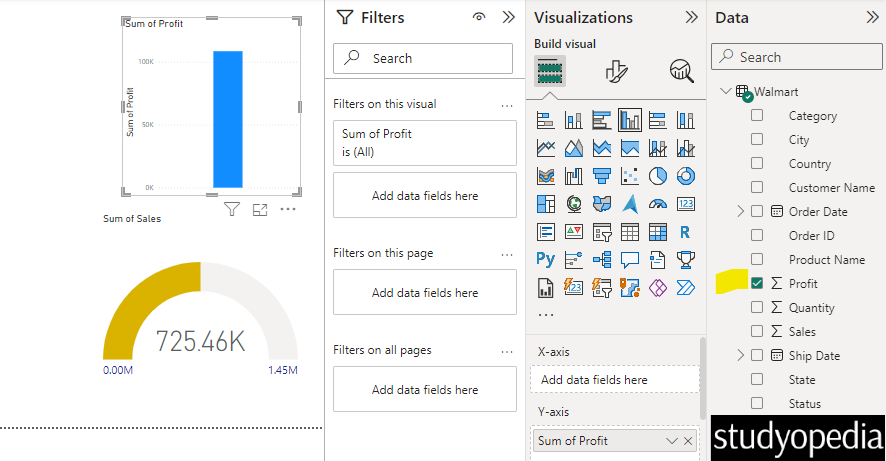
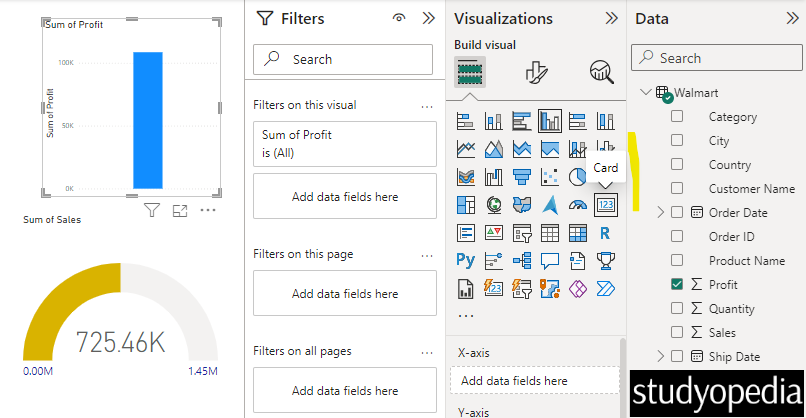
Convert the above visualization to a card. Go to the Visualization pane, and click Card as shown below:
The card in Power BI is now visible on the top. Drag wherever you want to place it:
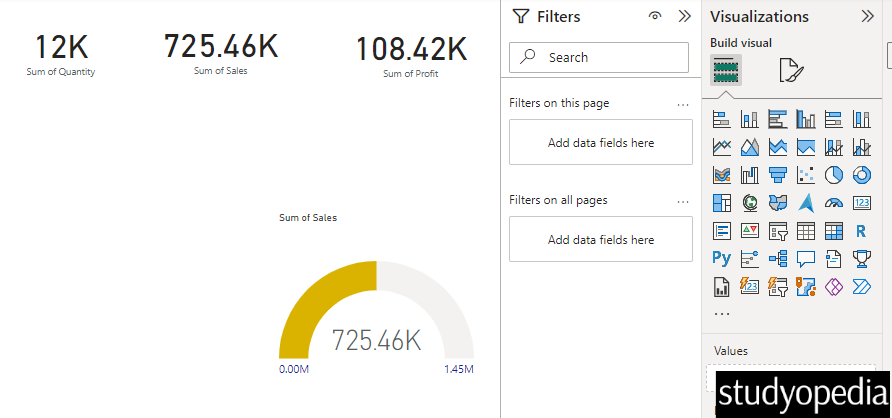
Similarly, I have added some more cards:
Video Tutorial
If you don’t want to follow written instructions, you can check out our video tutorial on how to create a card in Power BI:
If you liked the tutorial, spread the word and share the link and our website Studyopedia with others.
For Videos, Join Our YouTube Channel: Join Now
Read More:
No Comments