09 Dec Data Analyst Roadmap
The role of a Data Analyst is crucial for any organization. The Data Analyst understands the data and extracts valuable insights that help track performance and scale the organization.

Let us see the roadmap to learning Data Analysis, step by step,
- What is Data Analysis
- Task of a Data Analyst
- Data Analysis – Steps
- Data Analysis with Python
- Python Libraries for Data Analysis
- Data Cleaning with the Pandas Library
- Data Standardization with the Pandas Library
- Data Manipulation with the Pandas Library
- Free resources to learn about Pandas
- Free resources to learn NumPy
- Free resources to learn Matplotlib
- Free resources to learn Python
- Data Analysis with Power BI
- Data Analysis with Tableau
- Data Analysis with SQL
- Free Data Analytics course playlist
What is Data Analysis
Data analysis is the process of inspecting, cleansing, transforming, and modeling data to discover useful information, conclude, and support decision-making. Here’s a breakdown of what it involves:
- Data Collection: Gathering data from various sources, which can be structured (like databases) or unstructured (like text files).
- Data Cleaning: Removing or correcting inaccurate records from a dataset to ensure data quality. This involves handling missing values, correcting errors, and removing duplicates.
- Data Transformation: Converting data into a suitable format for analysis. This can include normalizing data, creating new variables, and aggregating data.
- Interpretation and Reporting: Analyzing the results and presenting them in a way that is easy to understand, often using charts, graphs, and dashboards to help communicate findings and insights.
Task of a Data Analyst
- Data Preparation: The first step is to prepare the data. It includes profiling, cleaning, and transforming the data. This makes the data ready. Data preparation takes the raw data and converts it into useful, easy-to-understand information. This process fixes the inaccurate data, identifies missing data, corrects the wrong data, etc.
- Model: After the preparation step, the data is ready to be modeled. This step determines how the tables are related to each other by defining and creating relationships between them.
- Visualize: The graphics are more easy to understand than the textual data, correct? The visualization steps bring data to life and represent it in the form of reports. This makes it quite easier to understand and make better decisions. This step designs and creates reports for accessibility.
- Analyze: Analyzing the data helps in finding insights, identifying patterns, and predicting outcomes. Interpret the information displayed in the report with the analysis step. With advanced analytics, business decisions become easier with meaningful results.
- Management: If you are an organization’s data analyst, you need to manage the reports, dashboards, semantic models, etc. of Power BI and supervise the sharing and distribution of reports and dashboards.
Data Analysis – Steps
Data analysis is the process of inspecting, cleansing, transforming, and modeling data to discover useful information, concluding, and supporting decision-making. Here’s a breakdown of what it involves:
- Data Collection: Gathering data from various sources, which can be structured (like databases) or unstructured (like text files).
- Data Cleaning: Removing or correcting inaccurate records from a dataset to ensure data quality. This involves handling missing values, correcting errors, and removing duplicates.
- Data Transformation: Converting data into a suitable format for analysis. This can include normalizing data, creating new variables, and aggregating data.
- Interpretation and Reporting: Analyzing the results and presenting them in a way that is easy to understand, often using charts, graphs, and dashboards to help communicate findings and insights.
Data Analysis with Python
“Data Analytics with Python” is a comprehensive topic that covers various aspects of using Python for data analysis. Here’s a high-level overview of what it might include:
- Introduction to Data Analytics: Understanding the basics of data analytics, its importance, and how Python fits into the data analytics landscape.
- Python Basics: Familiar with Python basics, including data types, control structures, functions, and libraries.
- Data Manipulation: Learning how to use libraries like Pandas for data manipulation, cleaning, and preparation.
- Data Visualization: Creating visual representations of data using libraries such as Matplotlib, Seaborn, and Plotly.
- Data Communication: Effective ways to present and communicate findings from data analysis.
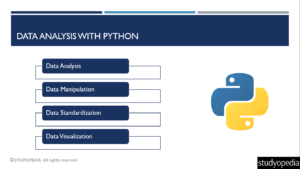
Data Analysis includes data manipulation, data standardization, etc;

Python Libraries for Data Analysis
To analyze data with Python, you need to use the top 3 Python libraries:
Data Cleaning with the Pandas Library
Data cleaning with Pandas is an essential step in the data analysis process to ensure that your dataset is accurate, consistent, and ready for analysis. Here is how you can achieve data cleaning with the Python Pandas library:
Note: Here, df is the dataframe, a two-dimensional data structure. More details about a dataframe in Pandas.
|
1 2 3 |
import pandas as pd |
Loading Data
|
1 2 3 |
df = pd.read_excel('your_dataset.xlsx') |
|
1 2 3 4 5 |
# Displays the first and last rows print(df.head()) print(df.tail()) |
|
1 2 3 4 |
# Counts missing values in each column df.isnull().sum() |
Dropping Missing Values:
|
1 2 3 4 |
# Removes rows with missing values df.dropna(inplace=True) |
Filling Missing Values:
|
1 2 3 4 |
# Replaces missing values with specified values df.fillna(value={'column_name': value},inplace=True) |
Removing Duplicates
|
1 2 3 4 |
# Removes duplicate rows df.drop_duplicates(inplace=True) |
Correcting Data Types
|
1 2 3 4 5 |
# Changes the data type of a column df['column_name'] = df['column_name'].astype('desired_data_type') |
Renaming Columns
|
1 2 3 4 |
# Renames columns df.rename(columns={'old_name': 'new_name'}, inplace=True) |
Data Standardization with the Pandas Library
Standardizing data is an essential step in preparing your data for analysis, ensuring consistency and comparability. These examples cover a range of standardization techniques that help ensure your data is clean, consistent, and ready for analysis:
|
1 2 3 |
df['column_name'] = df['column_name'].str.lower() |
|
1 2 3 |
df['column_name'] = df['column_name'].str.strip() |
|
1 2 3 |
df['date_column'] = pd.to_datetime(df['date_column'], format='%Y-%m-%d') |
|
1 2 3 |
df['num_column'].fillna(df['num_column'].mean(), inplace=True) |
Data Manipulation with the Pandas Library
- Add a new column: https://studyopedia.com/pandas/add-new-column-dataframe/
- Delete rows/ columns: https://studyopedia.com/pandas/delete-rows-colums-dataframe/
- Iterate over rows and columns: https://studyopedia.com/pandas/iterate-over-rows-columns/
- Pandas – Sorting: https://studyopedia.com/pandas/python-pandas-sorting/
Pandas Free Video Tutorial
Let us learn about Pandas via a video tutorial in English:
Let us learn about Pandas via a video tutorial in Hindi:
NumPy Free Video Tutorial
Let us learn about NumPy via a video tutorial in English:
Let us learn about NumPy via a video tutorial in Hindi:
Matplotlib Free Video Tutorial
Let us learn about Matplotlib via a video tutorial in English:
Let us learn about Matplotlib via a video tutorial in Hindi:
Python Free Video Tutorial
Let us learn about Python via a video tutorial in English:
Let us learn about Python via a video tutorial in Hindi:
Data Analysis with Power BI
Power BI is a business intelligence tool that gets data from different sources, such as Excel, JSON, PDF, etc., and can be analyzed and converted to meaningful reports, dashboards, charts, etc. This assists in making business decisions by tracking performance.
Power BI is a robust data analysis tool developed by Microsoft that enables users to connect to various data sources, transform raw data into meaningful insights, and create interactive visualizations.
With Power BI, you start by importing data from sources like Excel, databases, and cloud services. Once the data is loaded, you can clean and transform it using Power Query to ensure it’s ready for analysis.
Power BI offers a range of visualization options, including charts, graphs, and maps, allowing you to represent your data visually intuitively and interactively. These visualizations can be combined into comprehensive dashboards that provide a holistic view of your data.
The tool also supports real-time data analysis, which is essential for monitoring and decision-making. After creating your dashboards and reports, you can share them with others through Power BI Service, allowing for collaboration and insights sharing across your organization. Power BI’s integration with other Microsoft products and its user-friendly interface makes it a powerful tool for anyone looking to harness the power of data for analysis and decision-making.
Power BI Free Video Tutorial
Data Analysis with Tableau
Tableau is a business intelligence tool that gets data from different sources and converts it into interactive, shareable dashboards. Tableau was founded in 2003.
Tableau is an exceptional tool for data analysis, widely recognized for its intuitive drag-and-drop interface and robust visualization capabilities. To start using Tableau, you first connect to your data source, which could be anything from a simple CSV file to a complex SQL database. Once connected, you can prepare and clean your data directly within Tableau, ensuring it’s ready for analysis.
Tableau allows you to create a variety of visualizations, from bar charts and line graphs to more complex representations like heat maps and scatter plots. These visualizations can be combined into interactive dashboards, which provide a comprehensive view of your data and enable users to explore it dynamically.
Additionally, Tableau supports real-time data analysis, allowing you to monitor and analyze data as it gets updated. Once your dashboards are ready, you can share them with others by publishing them to Tableau Server or Tableau Online, or export them in various formats for distribution. This makes Tableau an indispensable tool for anyone looking to gain insights from their data and share those insights with others.
Tableau Free Video Tutorial
Data Analysis with SQL
SQL, or Structured Query Language, is a powerful tool for data analysis that allows you to interact with and manipulate databases. Using SQL, you can extract relevant data from large datasets stored in relational databases. This involves writing queries to select specific fields, filter records based on conditions, and join multiple tables to create comprehensive datasets.
SQL also enables you to perform aggregations, such as calculating sums, averages, and counts, which are essential for summarizing data. Additionally, SQL supports data transformation by allowing you to create calculated fields and update records. The results of SQL queries can be used for further analysis, reporting, and visualization, making it an indispensable skill for data analysts who need to efficiently manage and analyze large volumes of data.
SQL Free Video Tutorial
Data Analysts Free Course Bundle
Free Data Analytics Courses(English): https://bit.ly/48MxVTU
Free Data Analytics Courses(Hindi): https://bit.ly/3u9crBG
If you liked the tutorial, spread the word and share the link and our website Studyopedia with others.
For Videos, Join Our YouTube Channel: Join Now
Read More:
- Python Tutorial
- Data Science Tutorial
- Machine Learning Tutorial
- Deep Learning Tutorial
- Statistics for ML Tutorial
- Numpy Tutorial
- Pandas Tutorial
- Matplotlib Tutorial
- Google Colab Tutorial
- Anaconda Tutorial


No Comments