08 Oct Descriptive Statistics
In Descriptive statistics, the observations are summarised from a set of data. It deals with the summary and analysis of data. Some of its measures include mean, median, mode, variance, standard deviation, etc. These measures assist us in understanding the central tendency, variability, and distribution of the data.
For example: you ask a sample of 100 people in a sports club if they like cricket as a sport.
You could make a bar chart of yes or no answers. This would be descriptive statistics.
Types of Descriptive Statistics
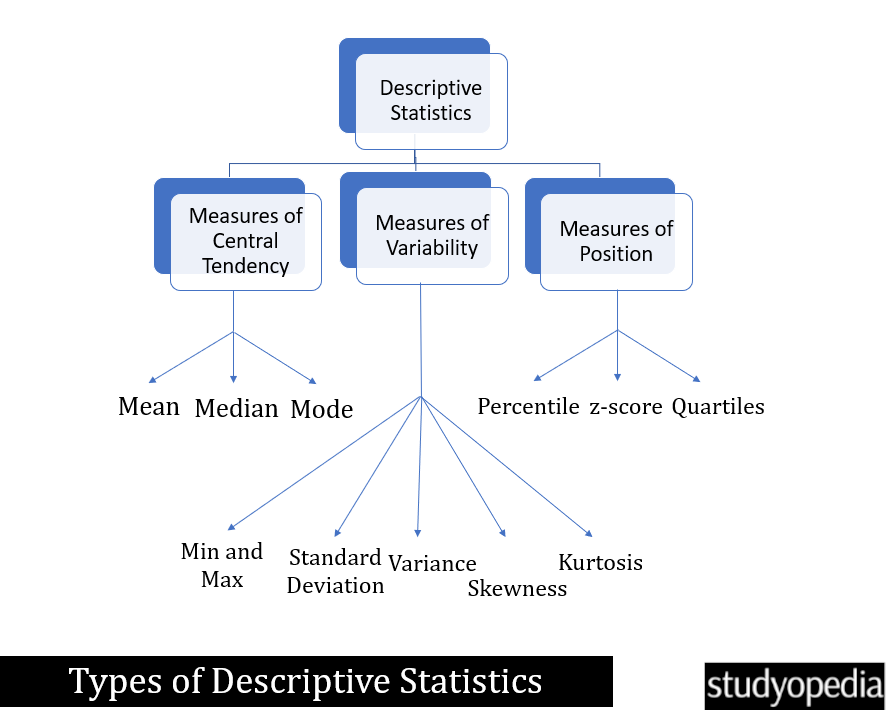
The following are the types of Descriptive Statistics:
- Measures of the Central Tendency
- Measures of Variability
- Measures of Position

The types are sub-divided further:
- Measure of Central Tendency: Includes the following measures:
- The Mean. It is the average value
- The Median. It is the middle value
- The Mode. It is the most common value
- Measures of Variability: It tells how spread out the data is. Includes the following measures:
- Min and Max
- Standard Deviation
- Variance
- Skewness
- Kurtosis
- Measures of Position: It tells where a particular data point stands relative to the rest of the data. Includes the following measures:
- Percentile
- Z-score (standard score)
- Quartiles
If you liked the tutorial, spread the word and share the link and our website Studyopedia with others.
For Videos, Join Our YouTube Channel: Join Now
Read More:
- What is Machine Learning
- What is a Machine Learning Model
- Types of Machine Learning
- Supervised vs Unsupervised vs Reinforcement Machine Learning
- What is Deep Learning
- Feedforward Neural Networks (FNN)
- Convolutional Neural Network (CNN)
- Recurrent Neural Networks (RNN)
- Long short-term memory (LSTM)
- Generative Adversarial Networks (GANs)


No Comments